Textmining Screen
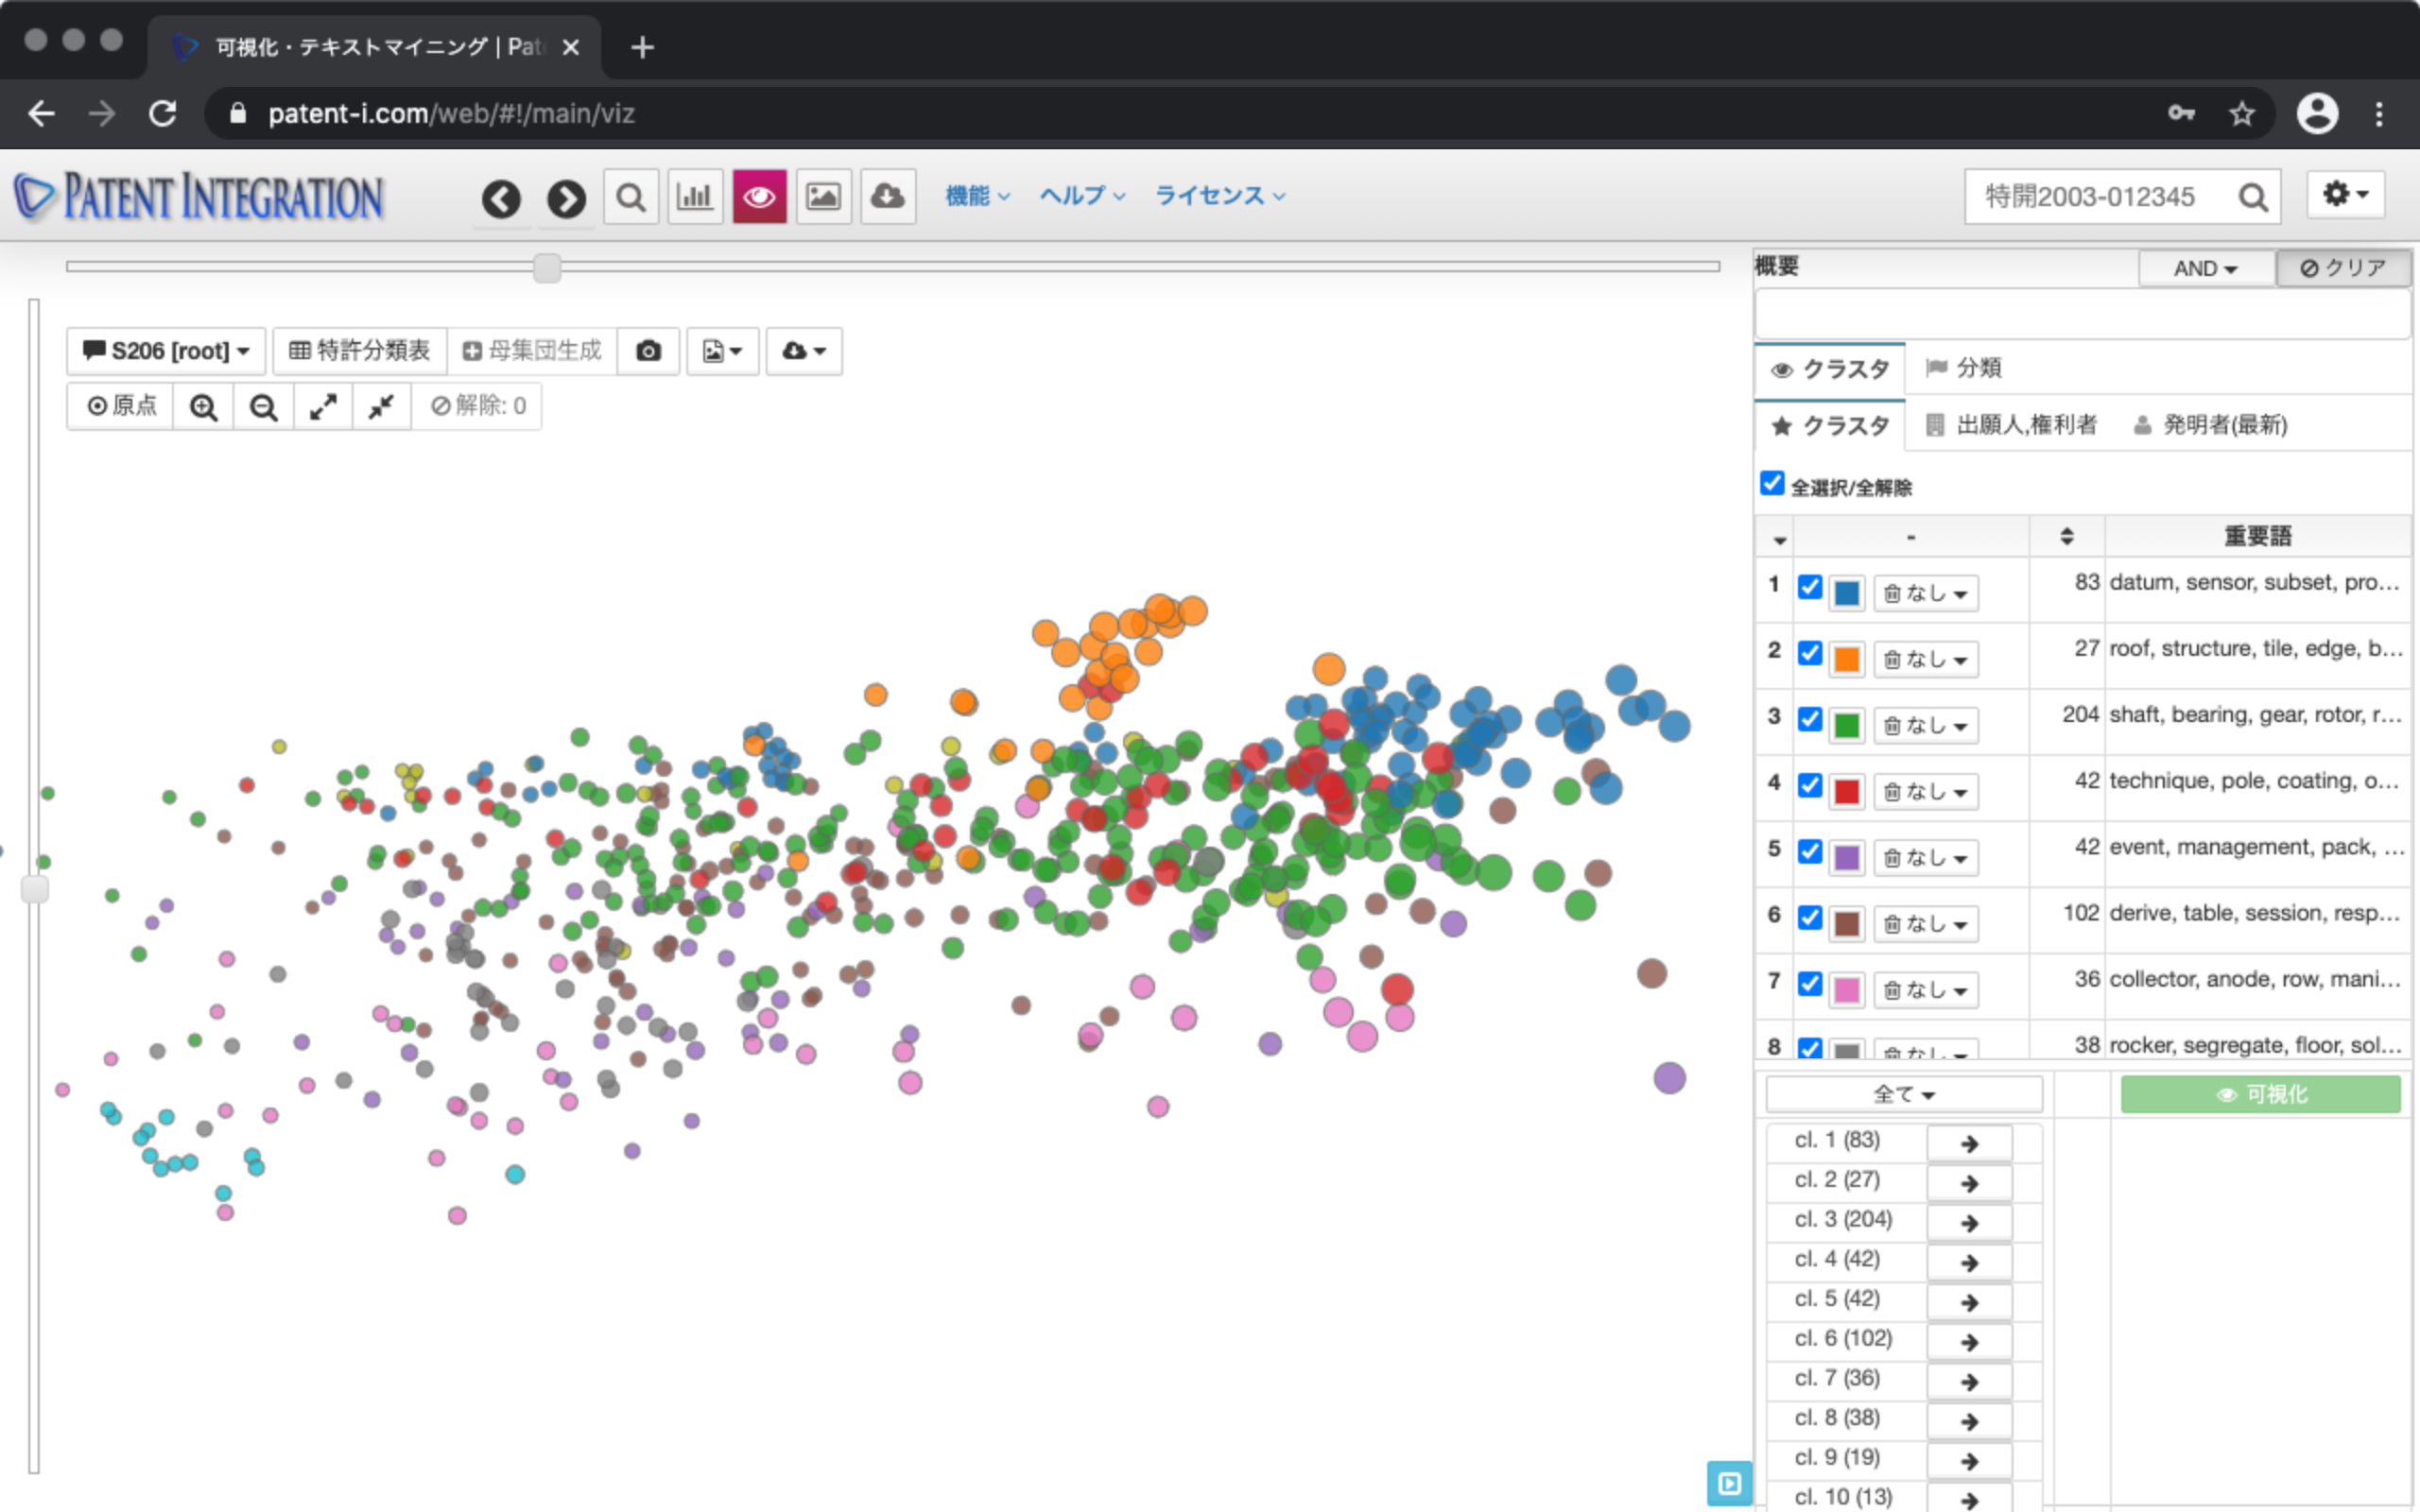
When the analysis process is completed, text mining processing is performed on the patent set to be analyzed, and the search set is visually visualized and displayed. In the visualization results, each dot is patentable and clustering is based on document similarity. The clustering results are displayed on the operation panel on the right side of the screen, and by checking the important words of each cluster, you can get a hint to understand what kind of technology each cluster is related to.
On the display screen, similar patents (dots) are placed closer and you can visually grasp the technology set. This makes it possible to intuitively understand what kind of viewpoint patent documents are included in the patent search set to be analyzed.
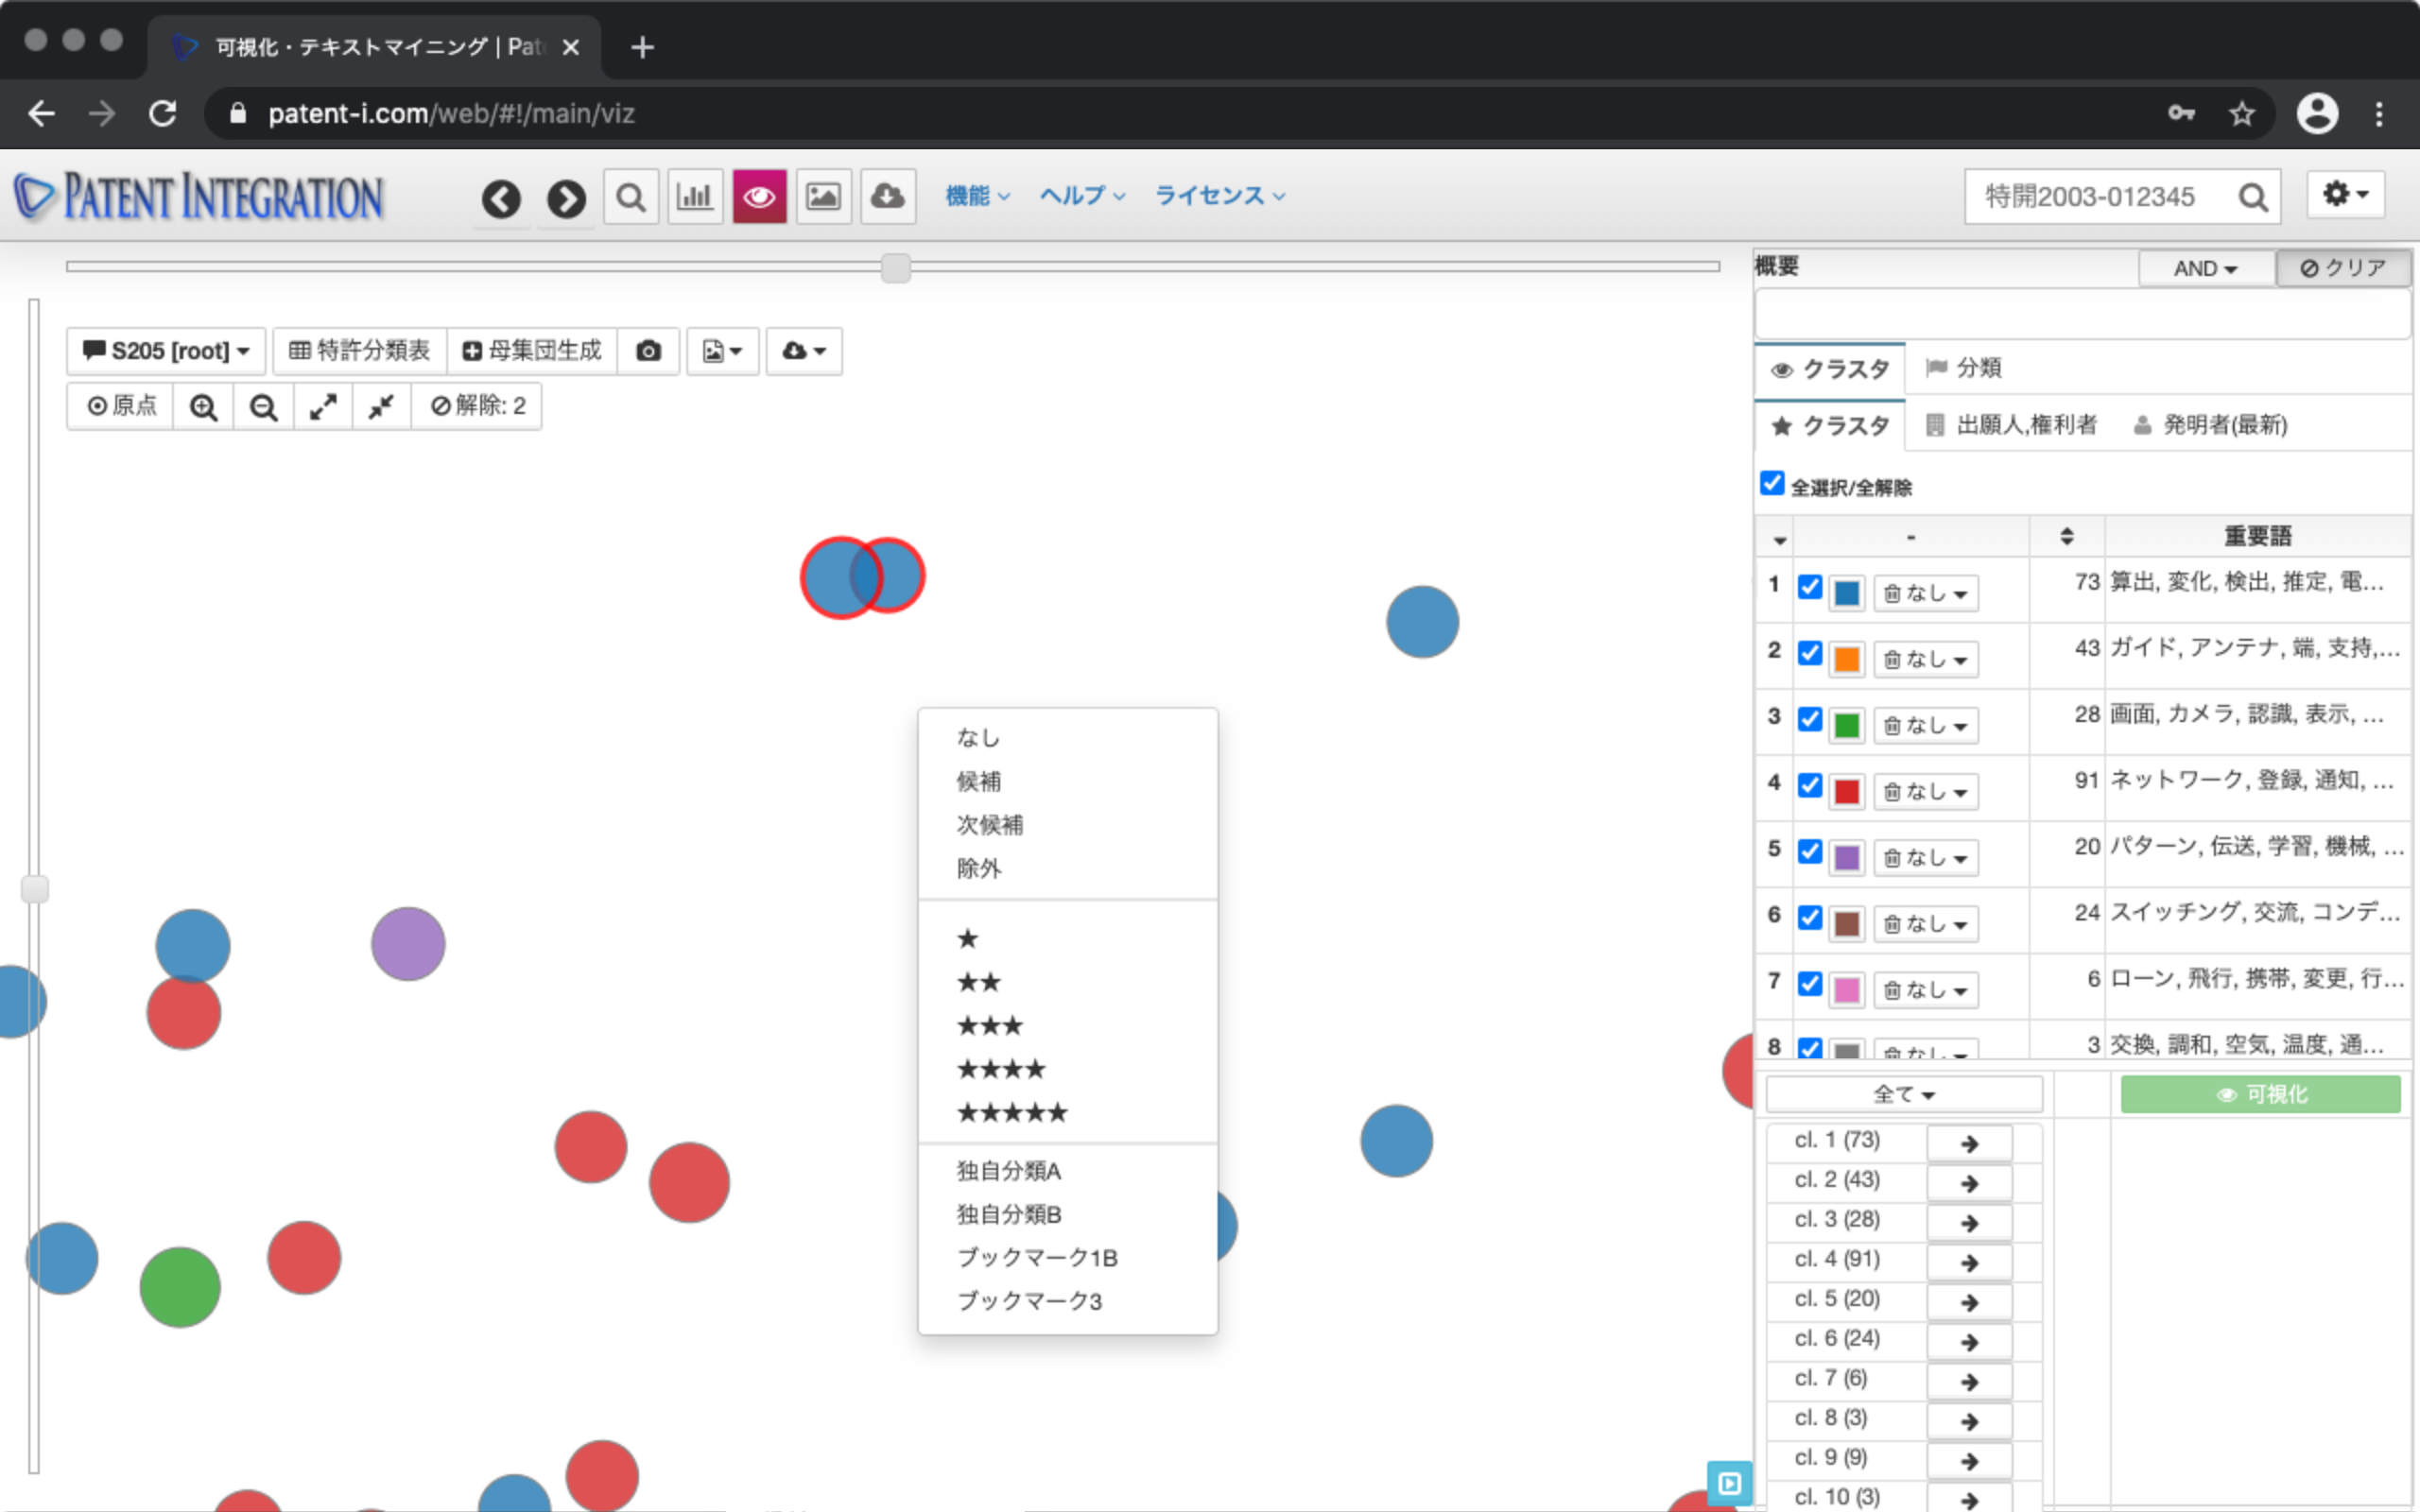
The visualized dots can be selected by holding down the shift key and dragging and dropping. Right-click on the screen to add User evaluation such as bookmarks, ratings, notes, patent bookmarks, etc. This allows you to screen your literature while qualifying your patent set.
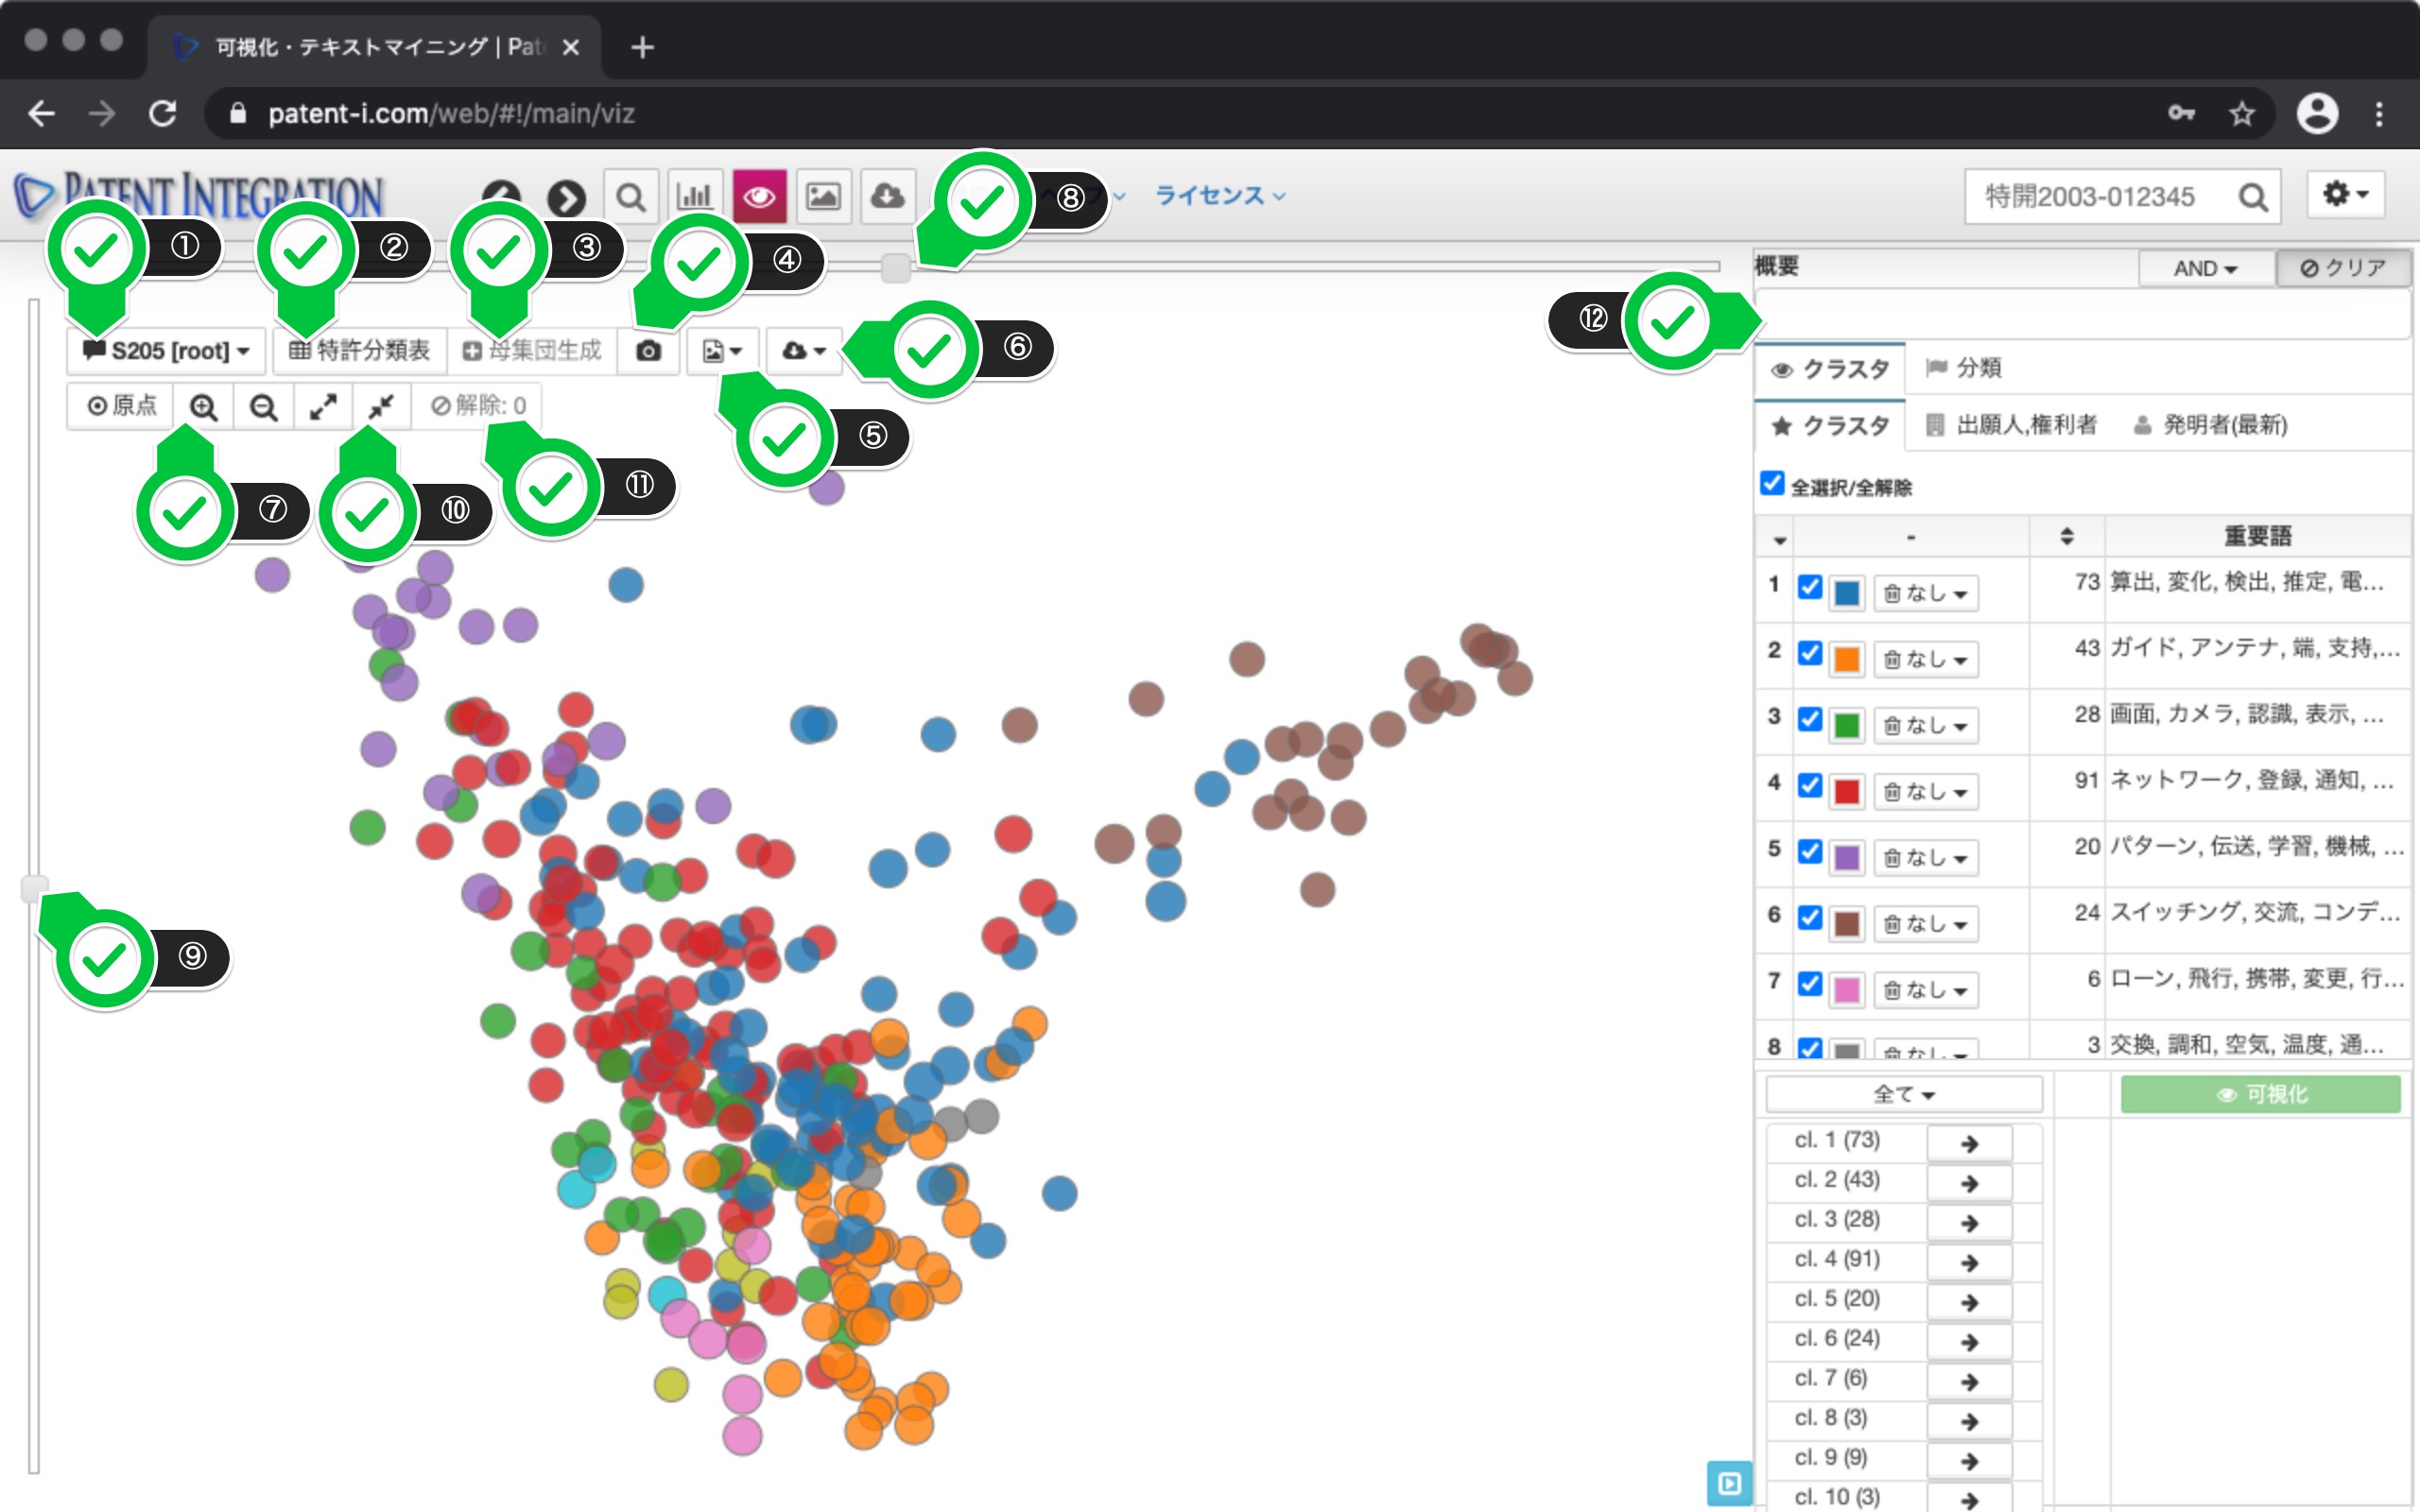
The user interface of the patent text mining screen is shown below.
| ① Memo button | Visualization result You can record notes in. Make a note of what you noticed during the patent analysis work. In addition, the ID of the search set and the ID of the visualization result are displayed on this button. You can check the recorded memo from the history management ( Search Result Control) of the search result control. |
| ② Patent classification table ( Search Result Control) | Visualized dots (each patent) You can add User evaluation to each patent document by right-clicking on). You can identify important patent classifications by applying the patent classification table ( Search Result Control) to patent documents with bookmarks. |
| ③ Population generation | Visualized dots (each patent) are shift keys You can select multiple dots by holding down and dragging and dropping. You can also add selected dots by holding down the control key and clicking on individual dots. Click the Population Generation button to create a new search set based on the selected patent document. The created search set is automatically added to the patent search results area of Patent Search Feature. The selected state can be canceled by clicking the cancel button below. |
| ④ Thumbnail | Thumbnail of the visualization result created in the past in the current search set. You can display the list in the format. You can redraw the visualization result by clicking it. You can also check and record memos. |
| ⑤ Image Download | Created graph (chart) in PNG , JPG, PDF, SVG format. It is used when the created graph is used for reporting materials. |
| ⑥ Data download | Copy the aggregated data to the clipboard or TSV Download in CSV format (comma separated text). It is used when the data is used in spreadsheet software such as Excel. |
| ⑦ Origin, enlargement/reduction | Visualize by clicking the origin button Returns the display of the result to the origin. You can zoom the visualization result with the enlarge/reduce buttons. The drawn visualization result can be enlarged/reduced by dragging and dropping with the mouse and scrolling. |
| ⑧ Time series slider | On the visualization screen, the newer the filing date, the closer to the front. It is plotted, and the one with the oldest filing date is visualized three-dimensionally on the back side. By manipulating the slider at the top, you can arrange the sets on the side, that is, in order of filing date. This allows you to qualify for the application trends and changes in the number of applications for each technology. |
| ⑨ Rotation slider | You can rotate the visualization result. It is used when you want to see the patent in the back when you see the visualization result from the side using the time series slider. |
| ⑩ Time series enlargement/reduction | Dot spacing in the time series direction (application You can widen or narrow the interval between days). If you want to see the structure of a dense area of applications in more detail, you can grasp the distribution of patent applications in more detail by widening the interval between filing dates. |
| ⑪ Release button | Dot selection status by clicking the release button Can be canceled. |
| ⑫ Operation panel | For each cluster or applicant for the visualization result You can check the color scheme and the distribution in the visualization results for each keyword and patent classification. See the next section for a detailed explanation. |
Patent text mining screen/user interface
Basic operation method of patent text mining function Is explained below.
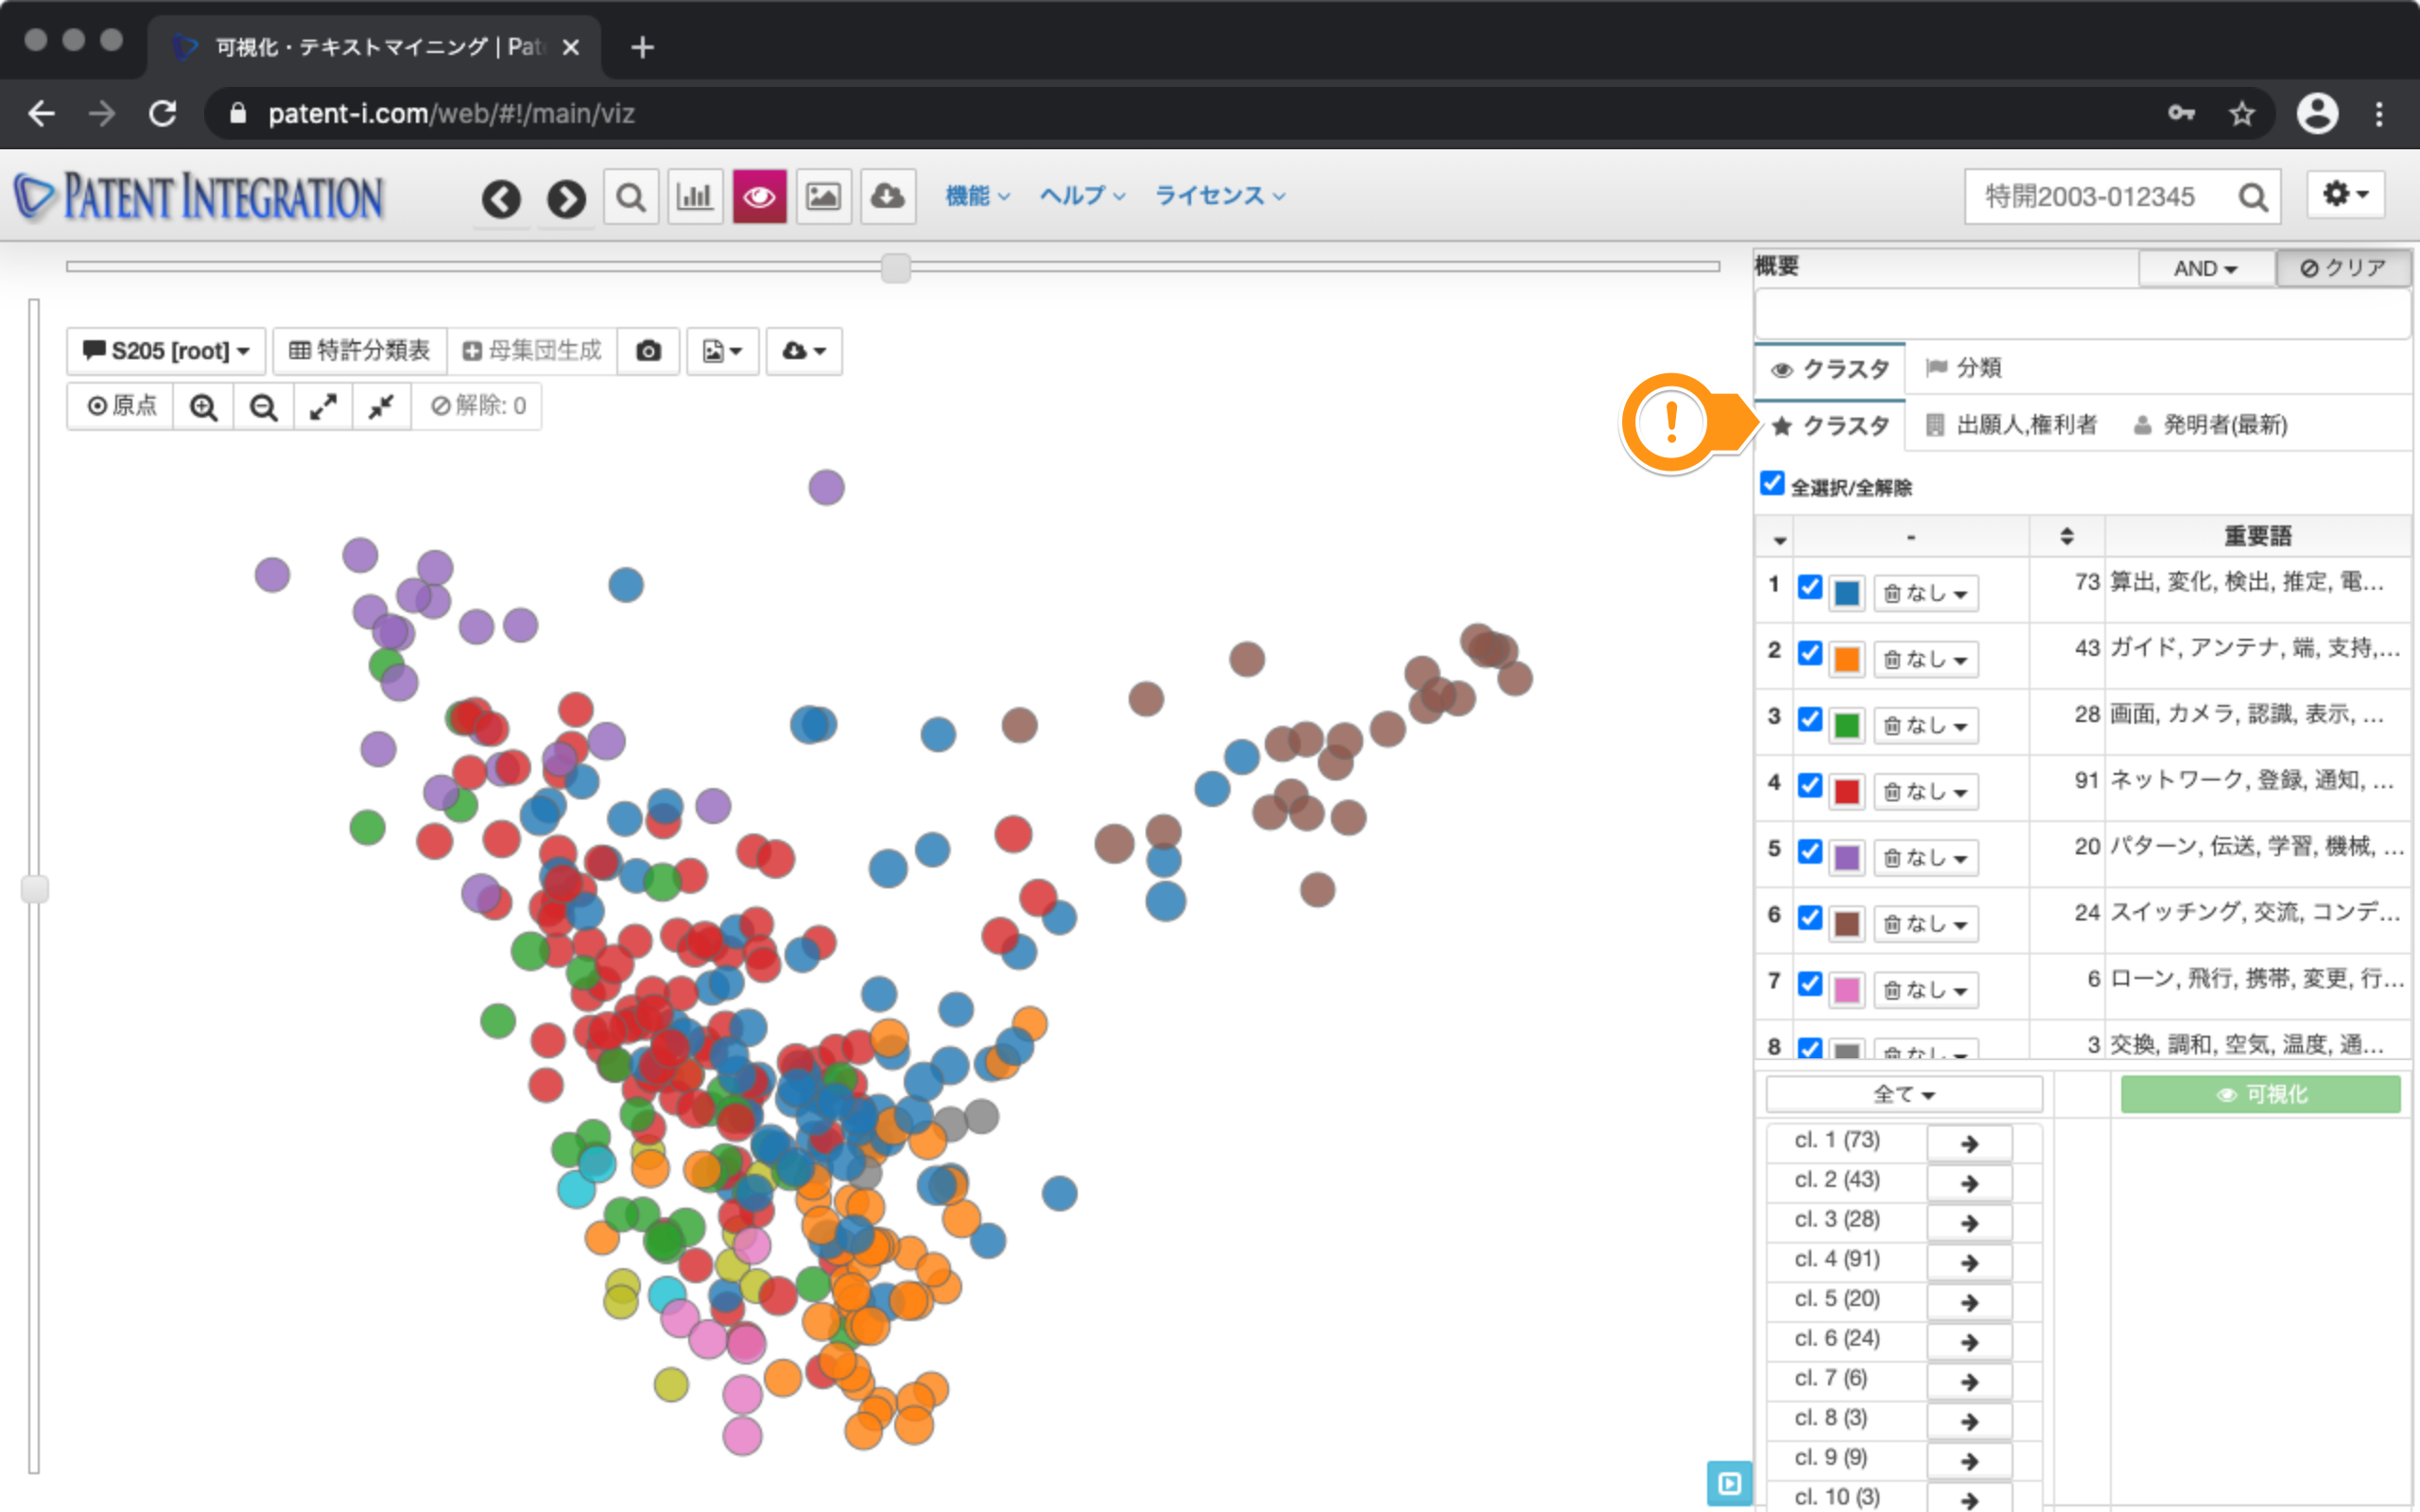
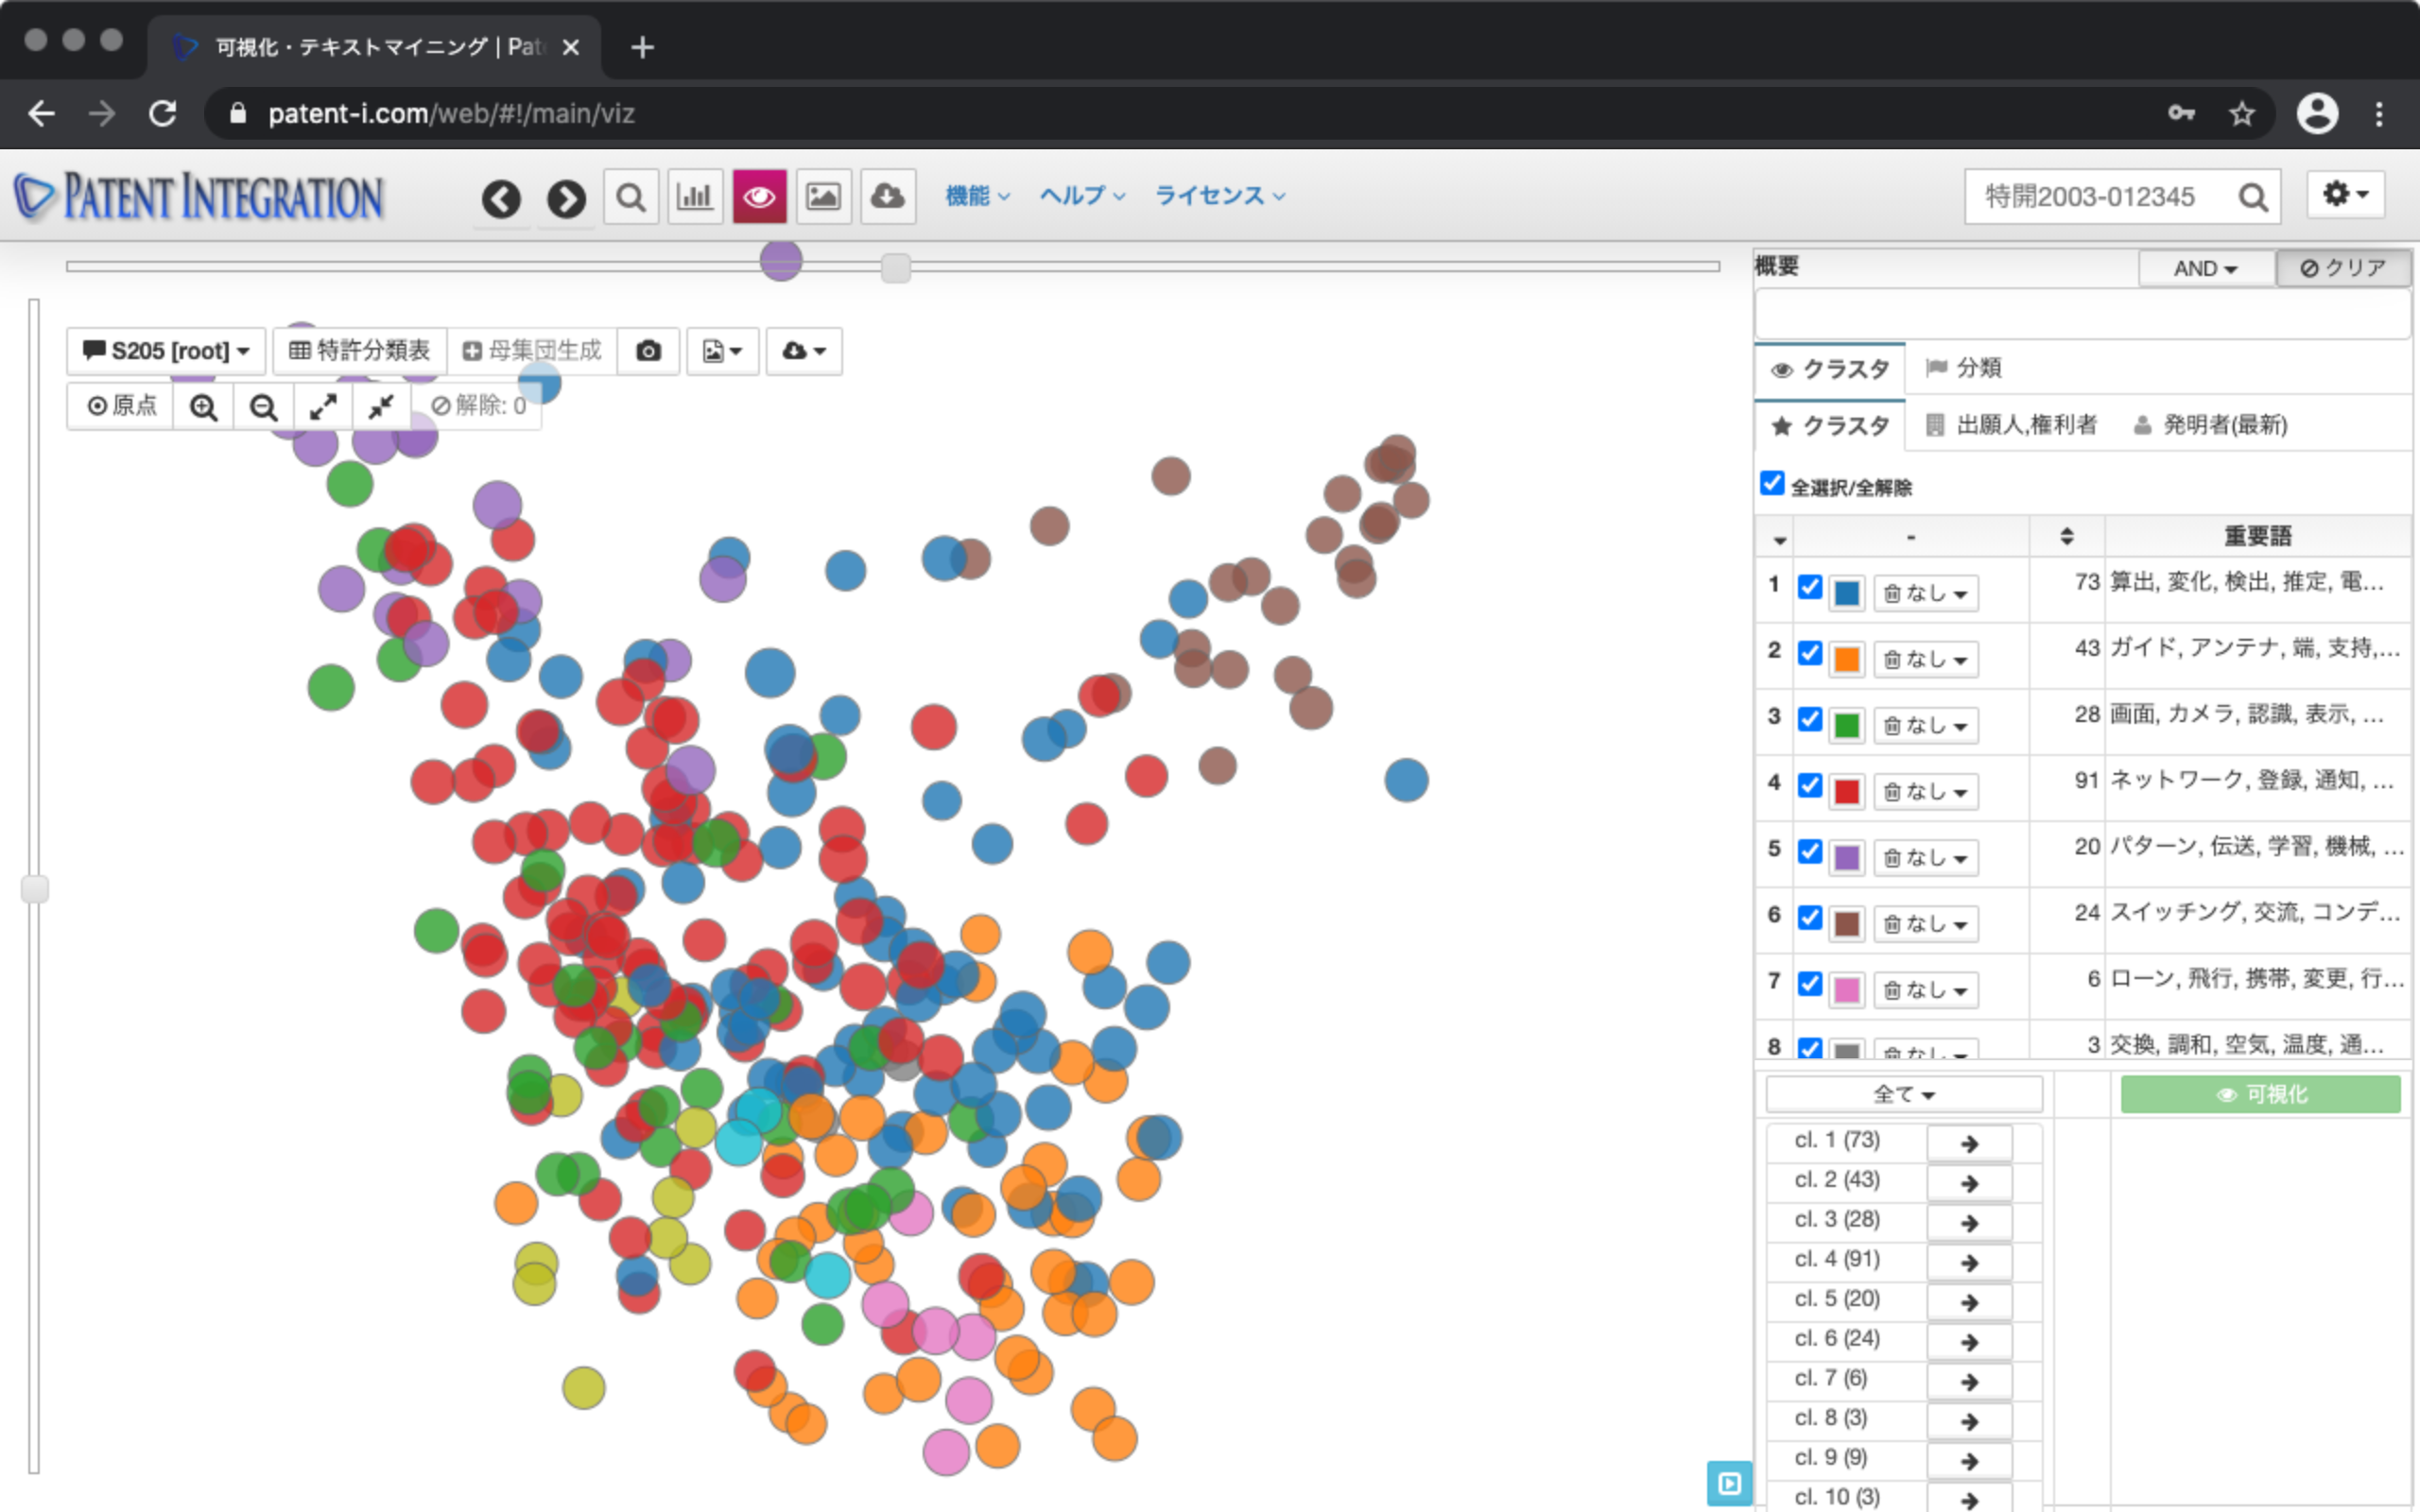
Checking the cluster
The operation panel on the right side of the screen lists the cluster descriptions corresponding to the colors for each cluster. The important words of each cluster are displayed on the right side of the cluster. This key word provides a hint for interpreting the analytical axis of the patent set, that is, what technology this set is made up of.
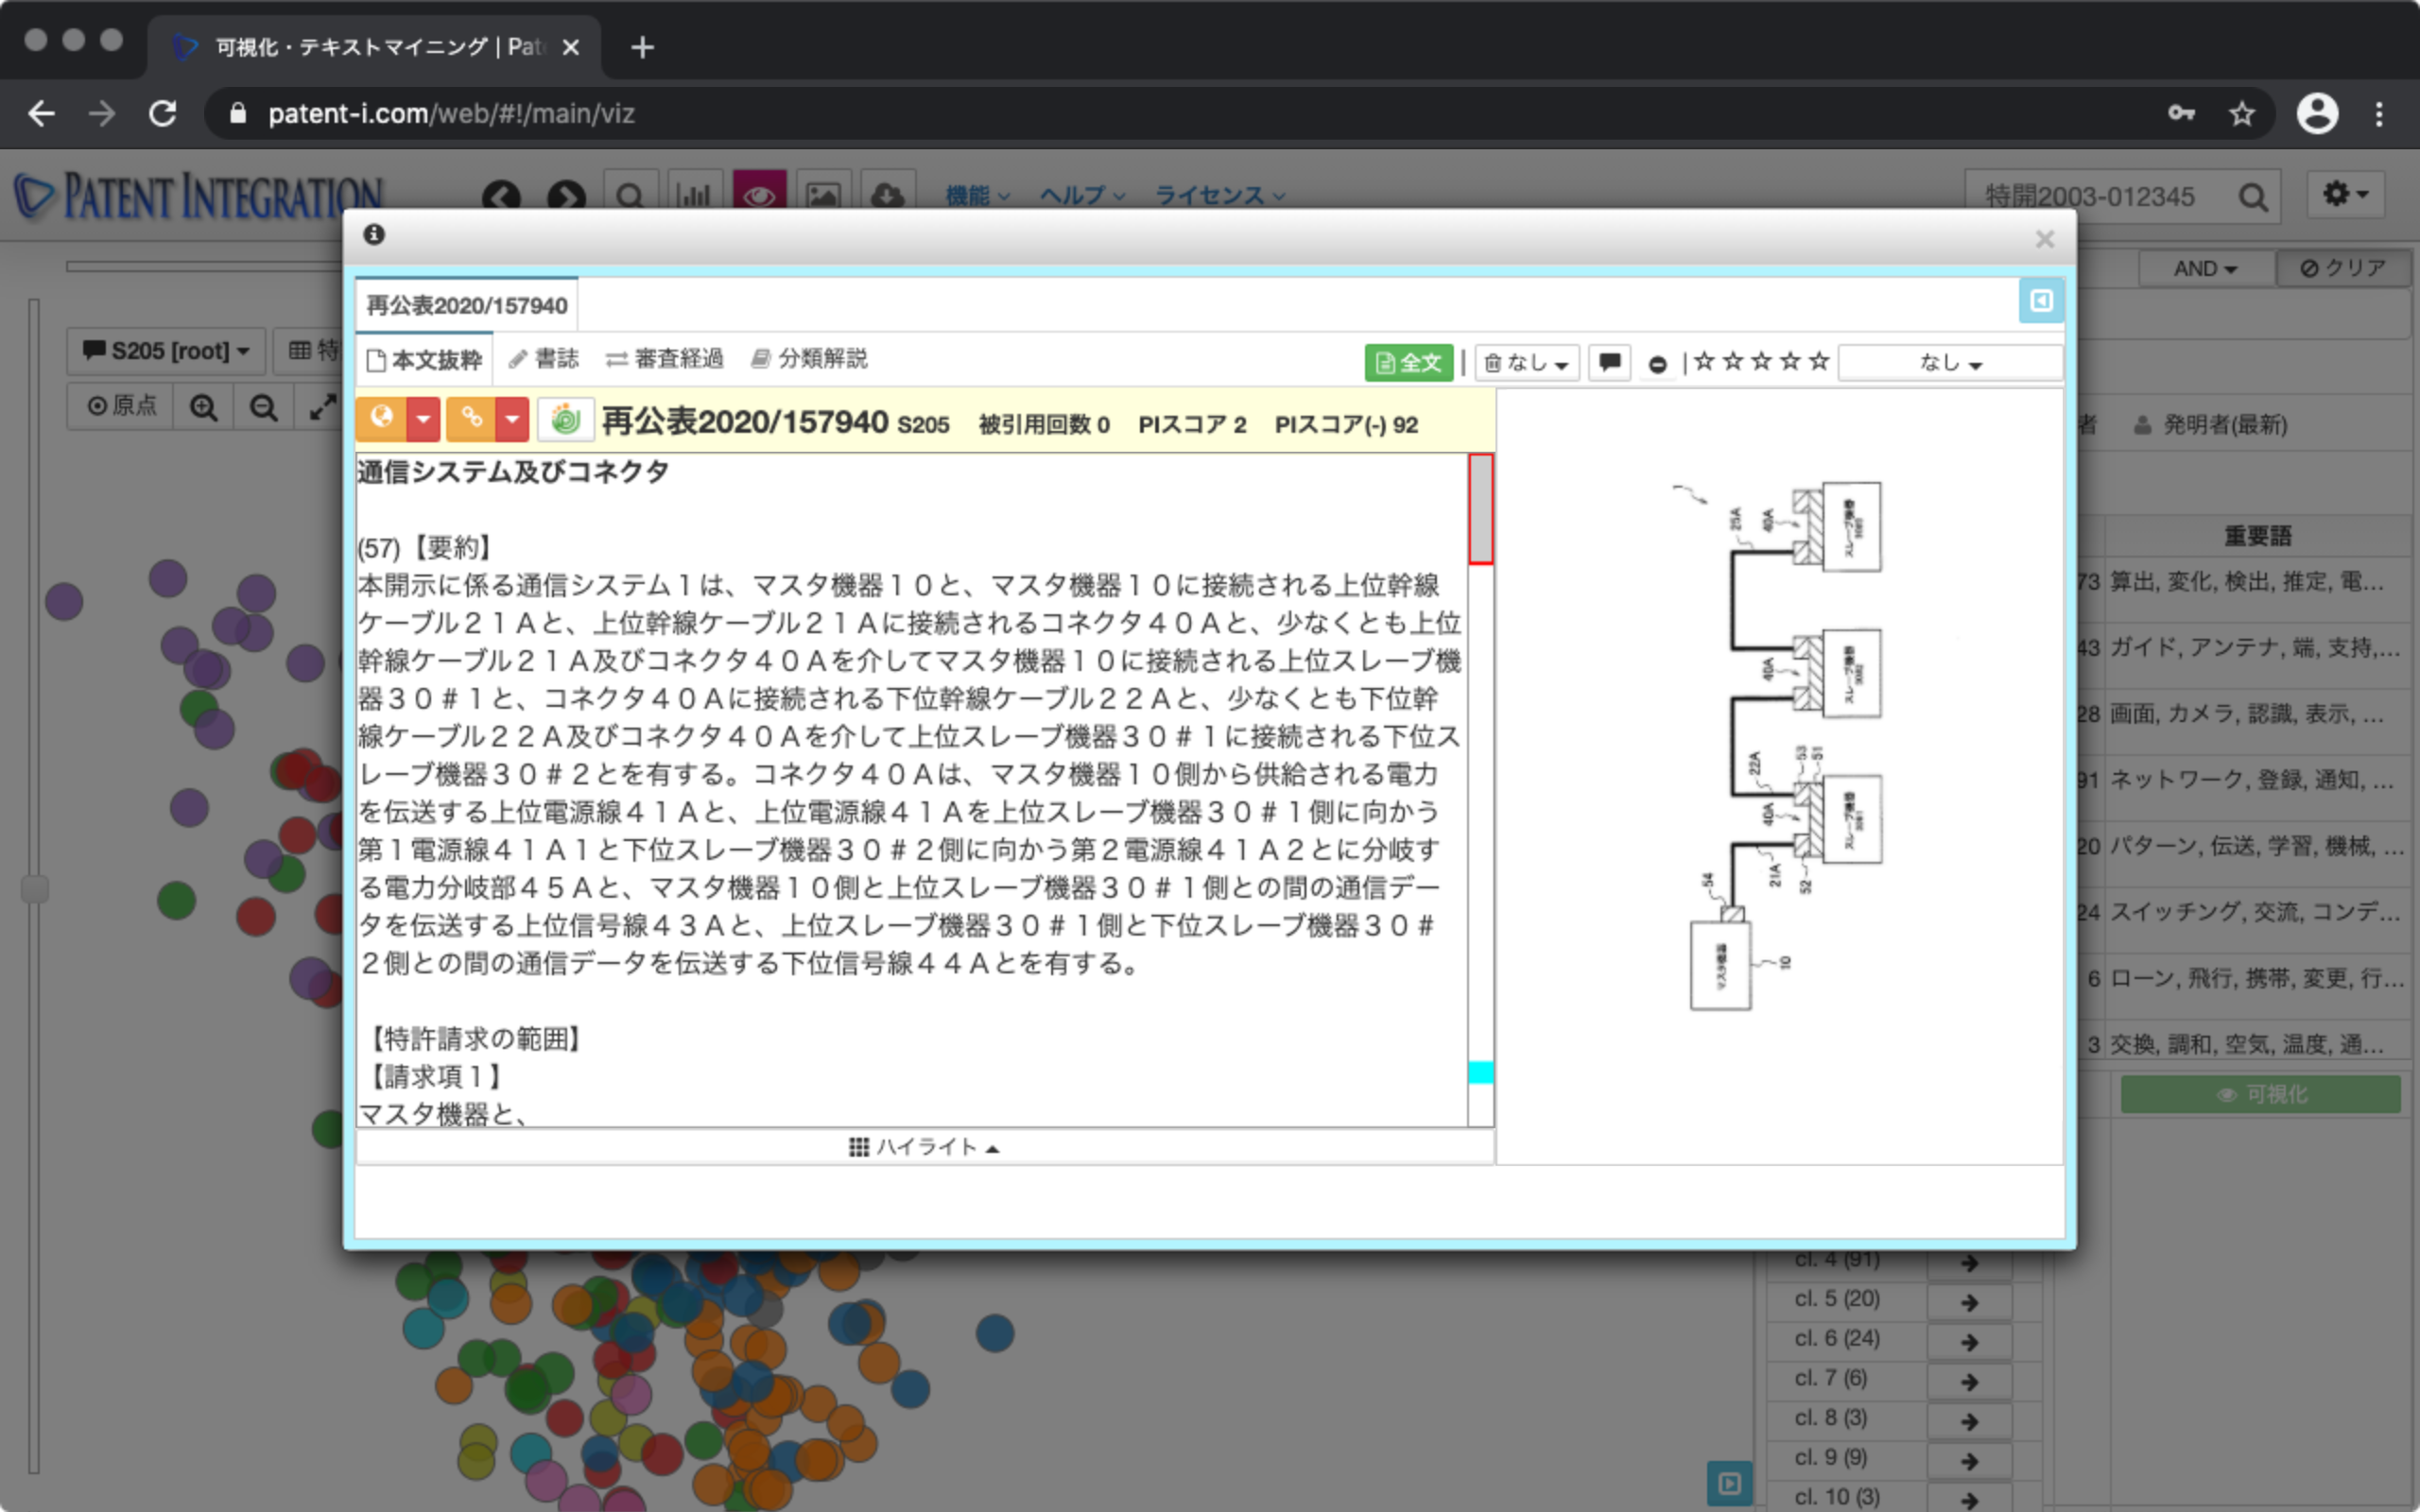
Confirmation of contents of patent gazette
Abstract each patent by clicking the dot It can be viewed in the format ( Abstract display function (individual matter)).
View from a time series perspective
The newer the filing date, the closer to the visualization screen. It is plotted in, and the one with the oldest filing date is visualized three-dimensionally on the back side. By manipulating the slider at the top, you can arrange the sets on the side, that is, in order of filing date. In this case, the patent with the old filing date is located on the left side, and the patent with the new filing date is located on the right side. You can return the display to the initial state by clicking the origin button.
Check the distribution of patent sets
In the control area on the right, this visualization You can check what kind of patents are positioned in the results. For example, click the Classification tab and then the Important Words tab to see a list of important words. You can narrow down the important words by entering power.
Next, you can click the keyword battery to display the flag for patents that include that keyword.
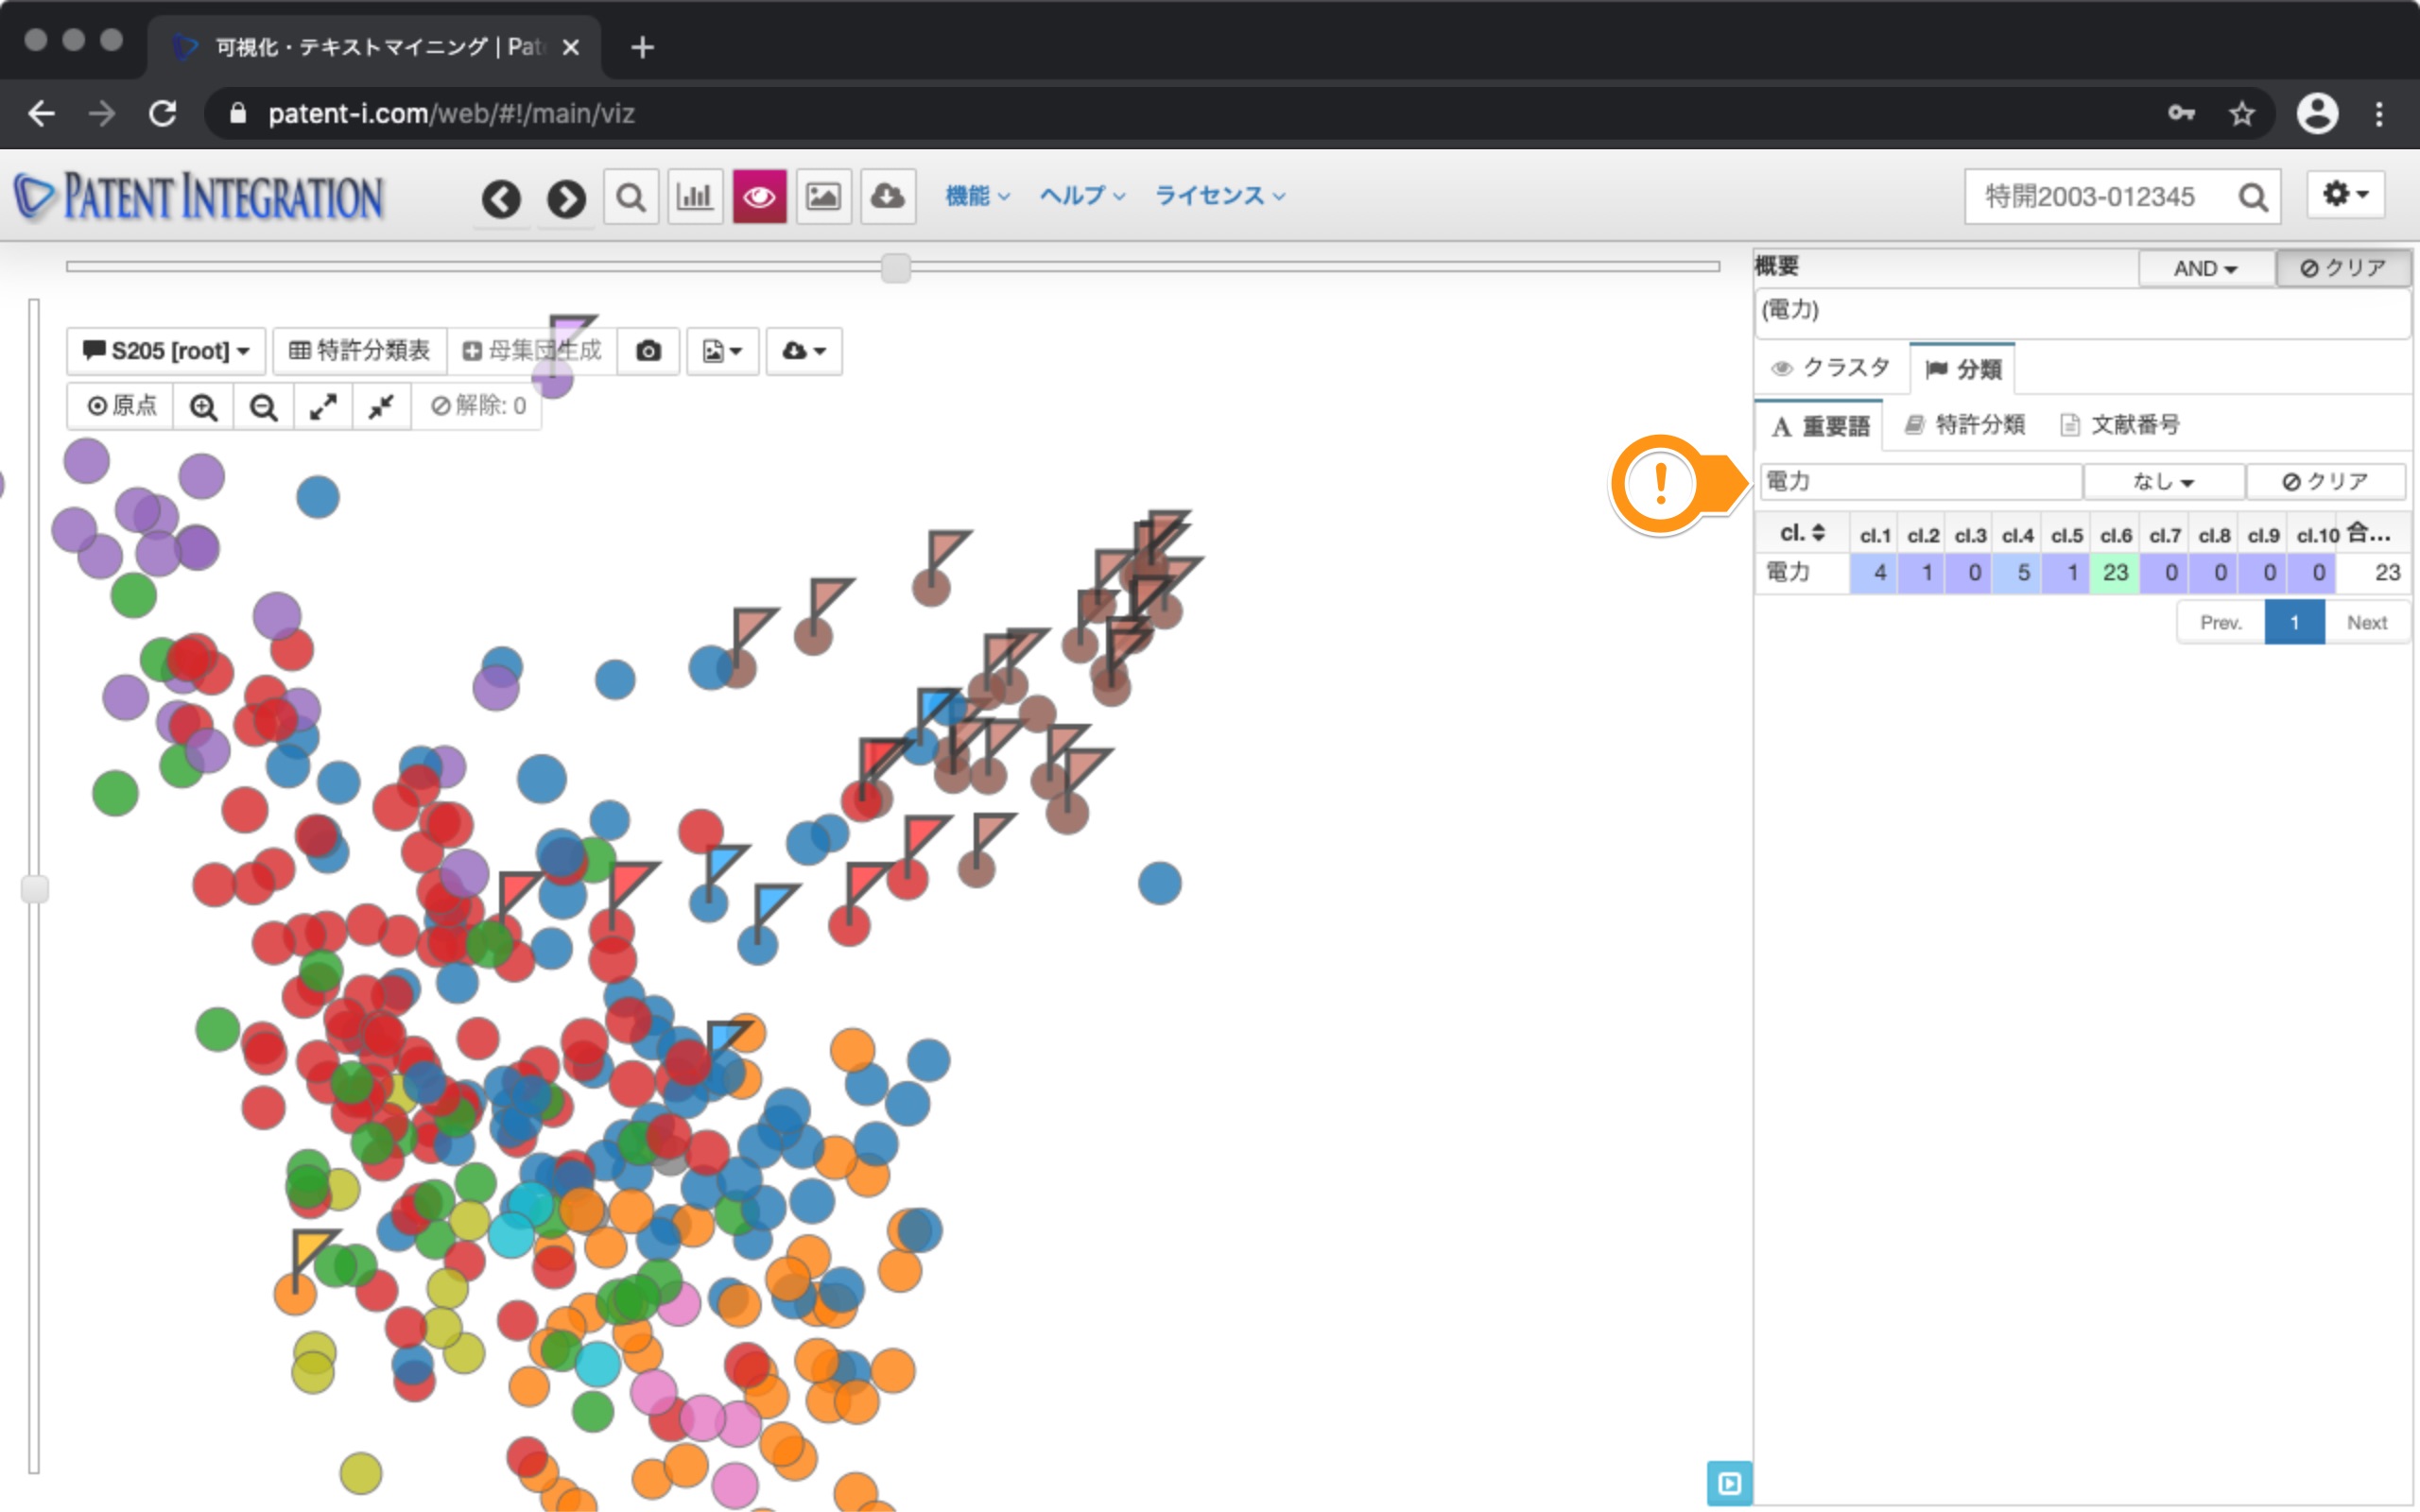
This allows you to identify patents that include batteries in the patent search set. This allows you to verify that the purple, red, pink, and light blue clusters are battery-related clusters, giving you a rough idea of the technical position of each patent.