Patent Map Wizard
Select a map from the patent analysis menu in Search Result Control to open the Patent Map Wizard screen. The Patent Map Wizard screen is shown below.
The user interface of the Patent Map Wizard is shown below.
| ① Map type | 1D You can select two types: map (1 axis) and 2D map (2 axes). Graph types such as line graphs and bar graphs can be selected after aggregation. |
| ② Aggregate value | Select the aggregation target. The default is the number of documents (number of patents), but you can also count by the number of citations. |
| ③ x-axis | Select the summary field for the first axis. For the summary field, you can select the filing date, applicant, patent classification, examination information/legal status field, and so on. The value is entered based on the period, range, and aggregation target specified by the aggregation range specification. You can also directly edit the text entered in the input field. If you want to change the series order of the summary series, edit the input field directly. For example, modify the input value of "A: B: C" to "C: A: B". " |
| ④ y-axis | Used only for 2D maps. 2 Select the summary field for the axis. The summary field is set in the same way as the x-axis. |
| ⑤ Specify the summary range | The aggregation range specification screen corresponding to the fields specified for the x-axis and y-axis is displayed, and you can specify the aggregation range for the x-axis and y-axis. By switching the tab, you can switch the aggregation range specification screen for each of the x-axis and y-axis. By clicking the candidate display button, you can display the aggregation candidates (period, range). |
| ⑥ Draw button | Aggregate within the aggregation range specified for the x-axis and y-axis Aggregate the values and draw a graph (patent map). |
Patent Map Wizard Screen/User Interface
>In the Patent Map Wizard, select the map type and aggregated value according to the graph you want to create. Then select the x-axis aggregate field for a 1D map or x for a 2D map. Select the summary fields for the axes and y-axis. Depending on the summary field you selected, the Summary Range specification screen for specifying candidates, time periods, and ranges appears on the right side of the Patent Map Wizard.
The specific operation procedure of the aggregation range specification screen is explained below.
Patent map by person
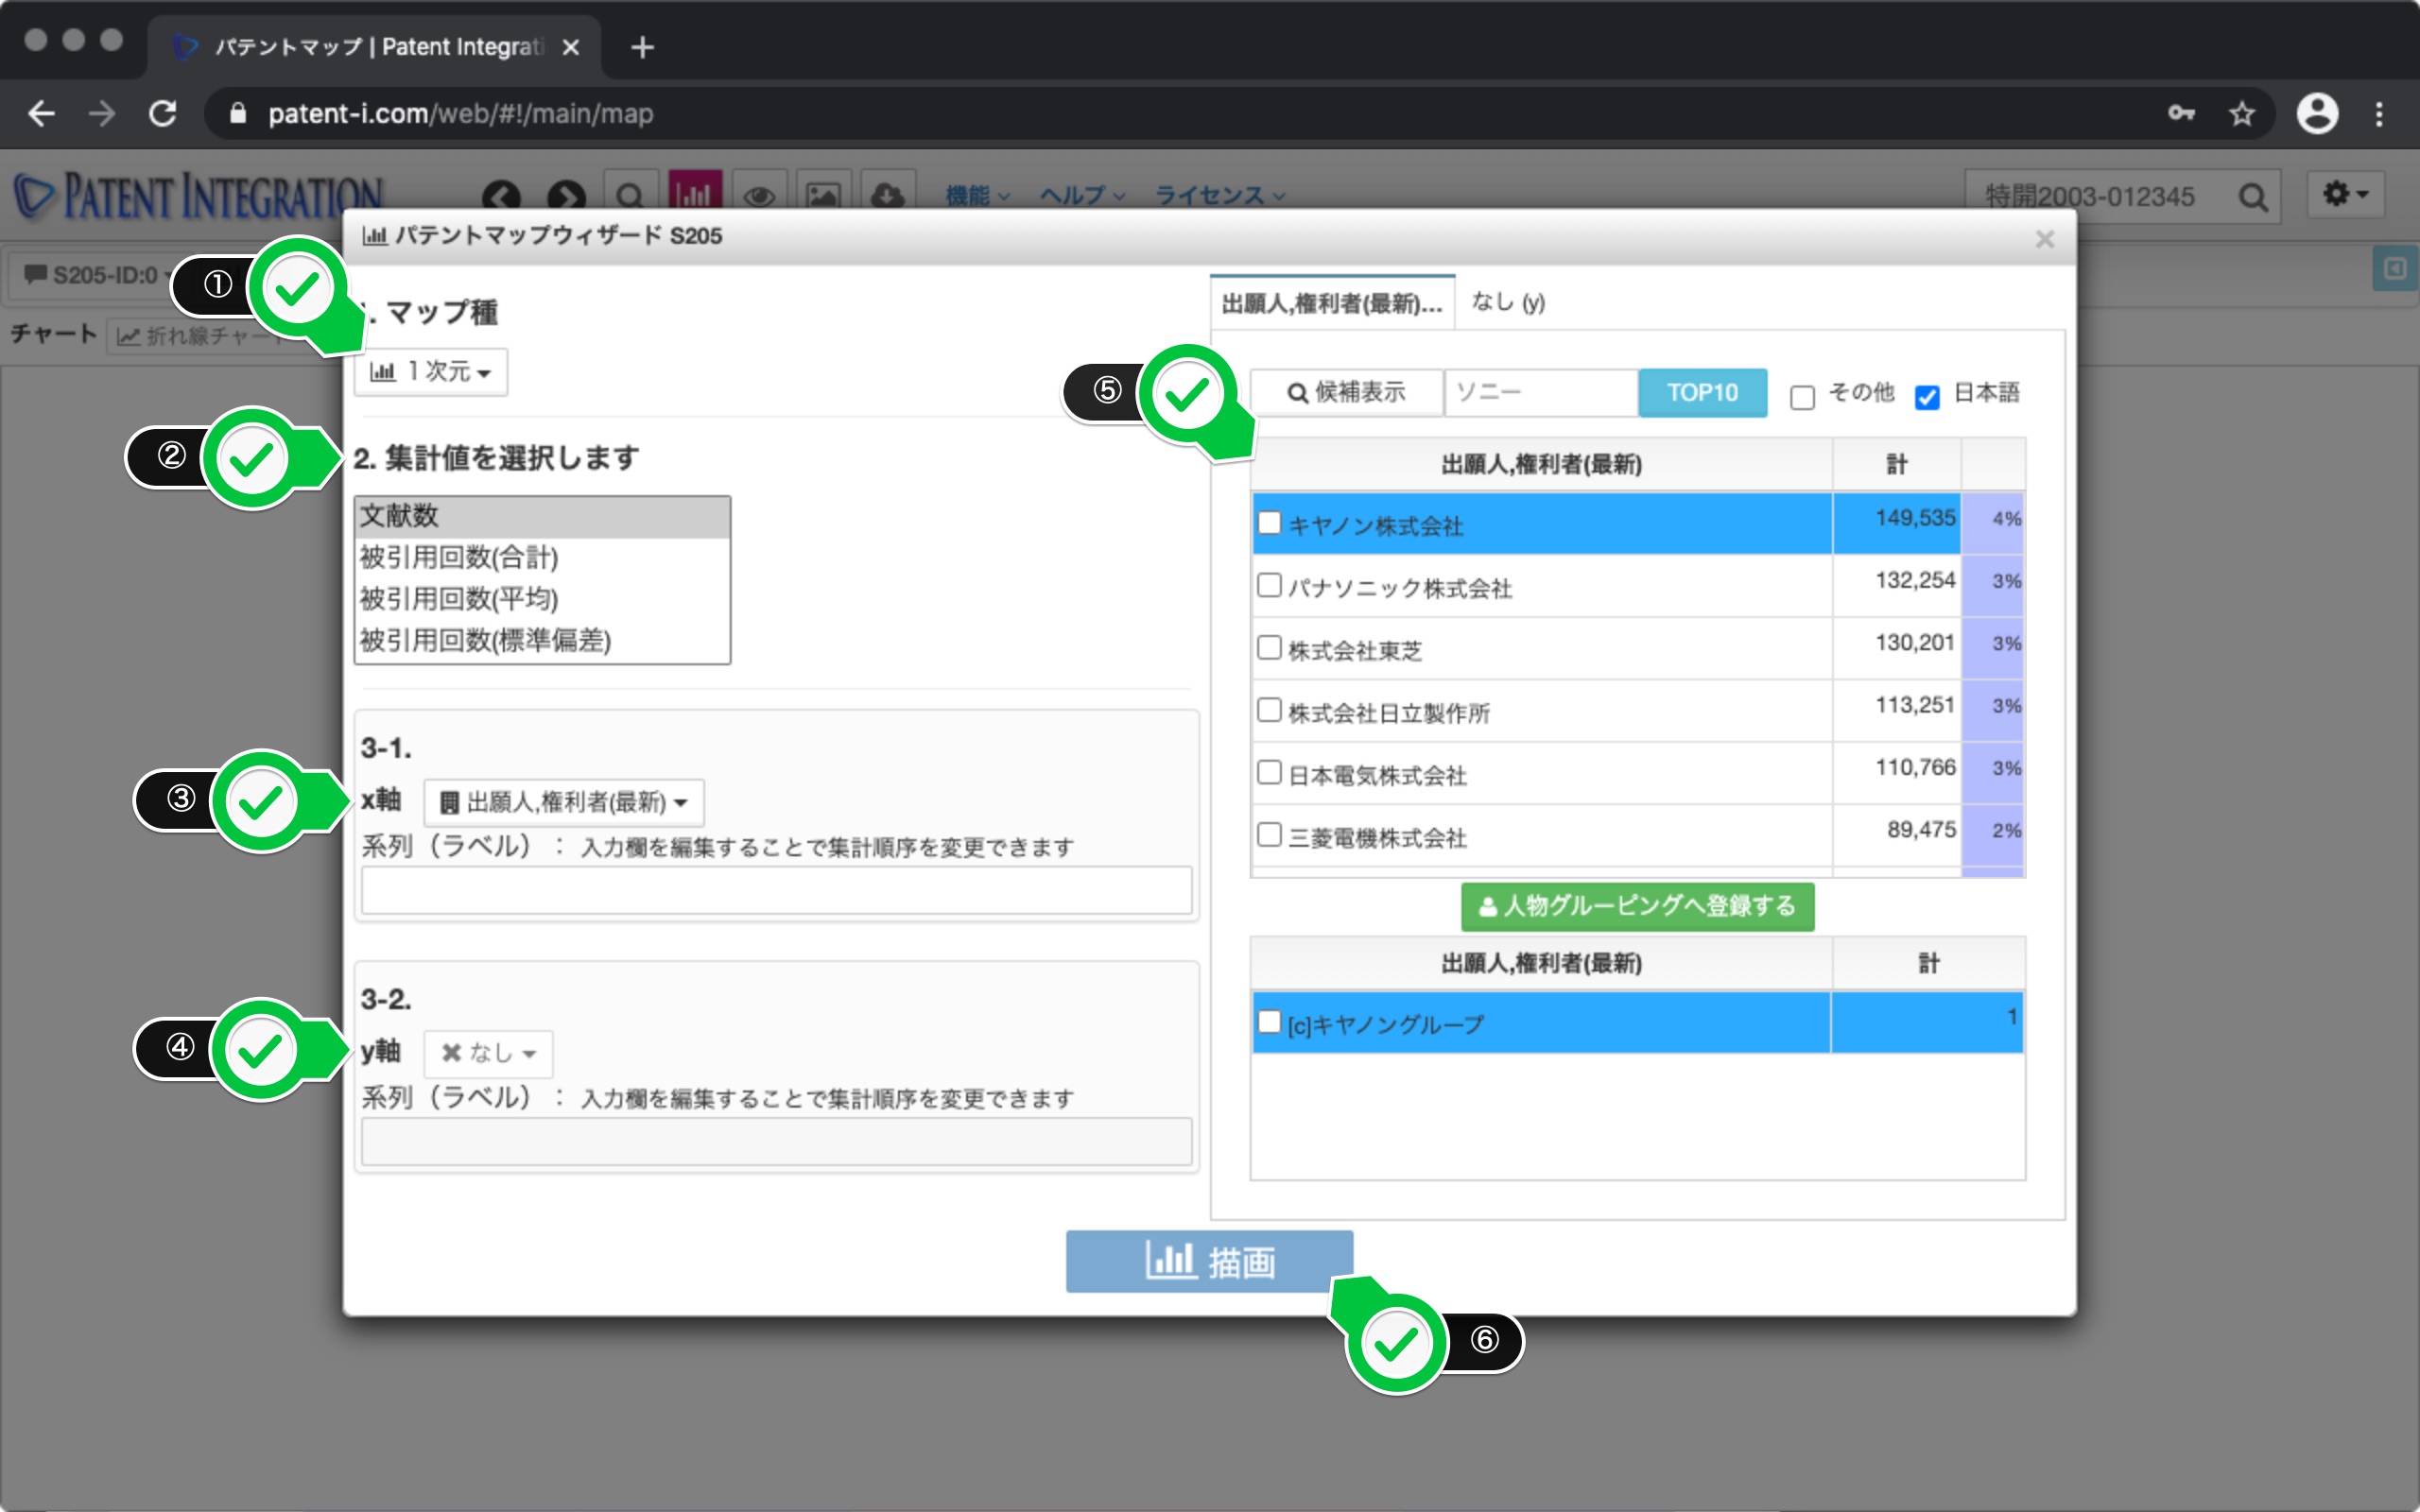
Patent map creation by person (applicant, inventor, etc.) The aggregation target specification screen for time is shown below.
lbox[/images/img_wiki/6_1_pmapperson.png | Aggregation target specification screen by person ]The user interface of the aggregation target specification screen by person is as follows. You can update the candidate display (ranking) of people included in the search set by clicking the candidate display button. You can also specify the prefix when displaying candidates (for example, enter Sony). , Only the names of people starting with Sony are displayed Will be).
You can select the aggregation target by checking the company name/person name to be aggregated.
| ① Candidate display button | Click By doing so, you can update the candidate display. |
| ② Prefix | Specify the prefix of the patent classification candidates to be listed. can. For example, if you enter Sony, only the person names (company names) that start with Sony will be displayed as candidates. It is used when you want to narrow down the display target to only group companies. |
| ③ TOP10 | Automatically select the top 10 candidates from the displayed candidates Select. |
| ④ Others | If checked, other (other than the selected one) (Number of cases) is included in the aggregation target. |
| ⑤ Japanese | If checked, only Japanese person names can be selected. It will be listed in. |
| ⑥ Candidate display | The candidates to be aggregated are displayed in a list. The number of patents for each person's name and the percentage included in the search set are also displayed. |
| ⑦ Button to register to person grouping | Person name displayed in the candidate display You can register it in Person Grouping by dragging and dropping. It is used when performing name identification. |
| ⑧ Name identification candidate | The person name displayed in the candidate display is used for person grouping. If registered, the group label of the person grouping will be displayed. By checking, the aggregation will be performed with the group label that has been identified. |
Patent map user interface by person
Patent map by date
The screen for specifying the aggregation range when creating a patent map by date (application date, publication date, etc.) is shown below.
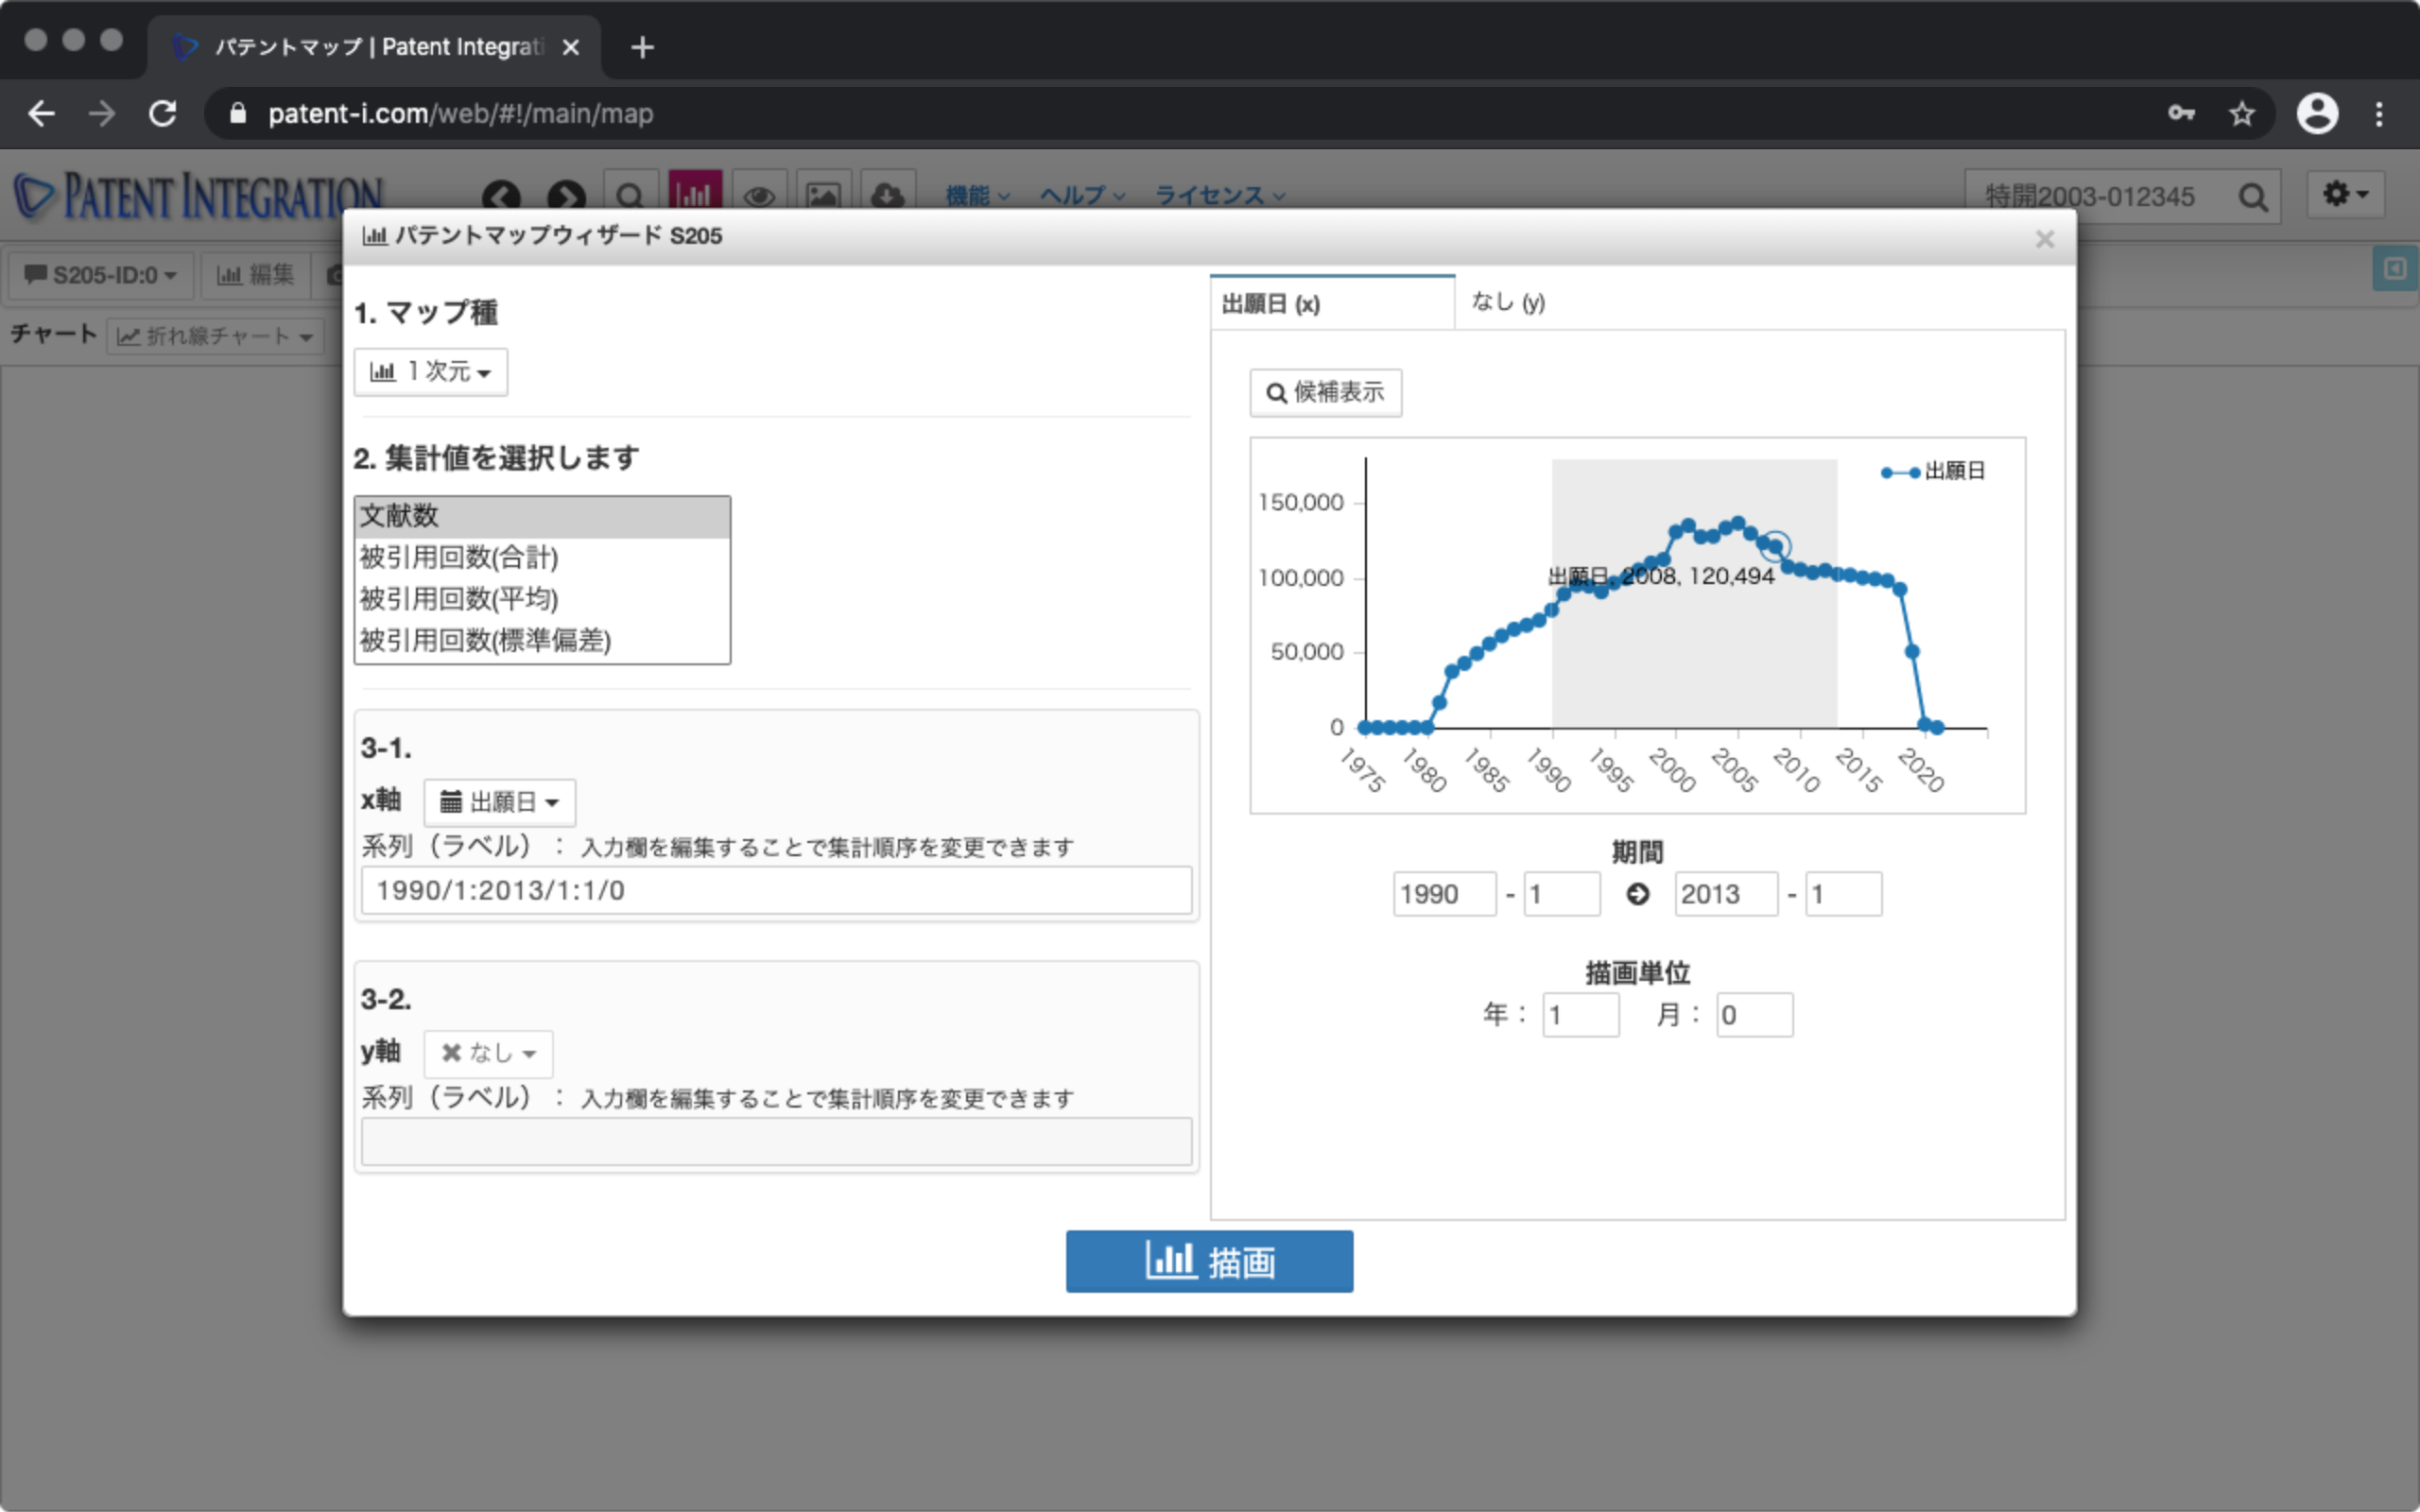
The user interface of the date-based aggregation range specification screen is shown below. If you click the candidate display button, a graph of the number of cases will be displayed, and you can specify the aggregation period by dragging and dropping the gray area. For example, you can specify peaks and valleys in the number of applications in a short time.
You can also specify the period by directly entering the value.
| ① Candidate display button | Click By doing so, you can update the candidate display. |
| ② Period | Aggregation period (start and end). You can also edit it directly. |
| ③ Drawing unit | Aggregation period unit (1 year unit, 1 month unit) Etc. Edit directly. |
Date-based aggregation range specification screen/user interface
Patent classification patent map
The screen for specifying the aggregation target when creating a patent map based on patent classification is shown below.
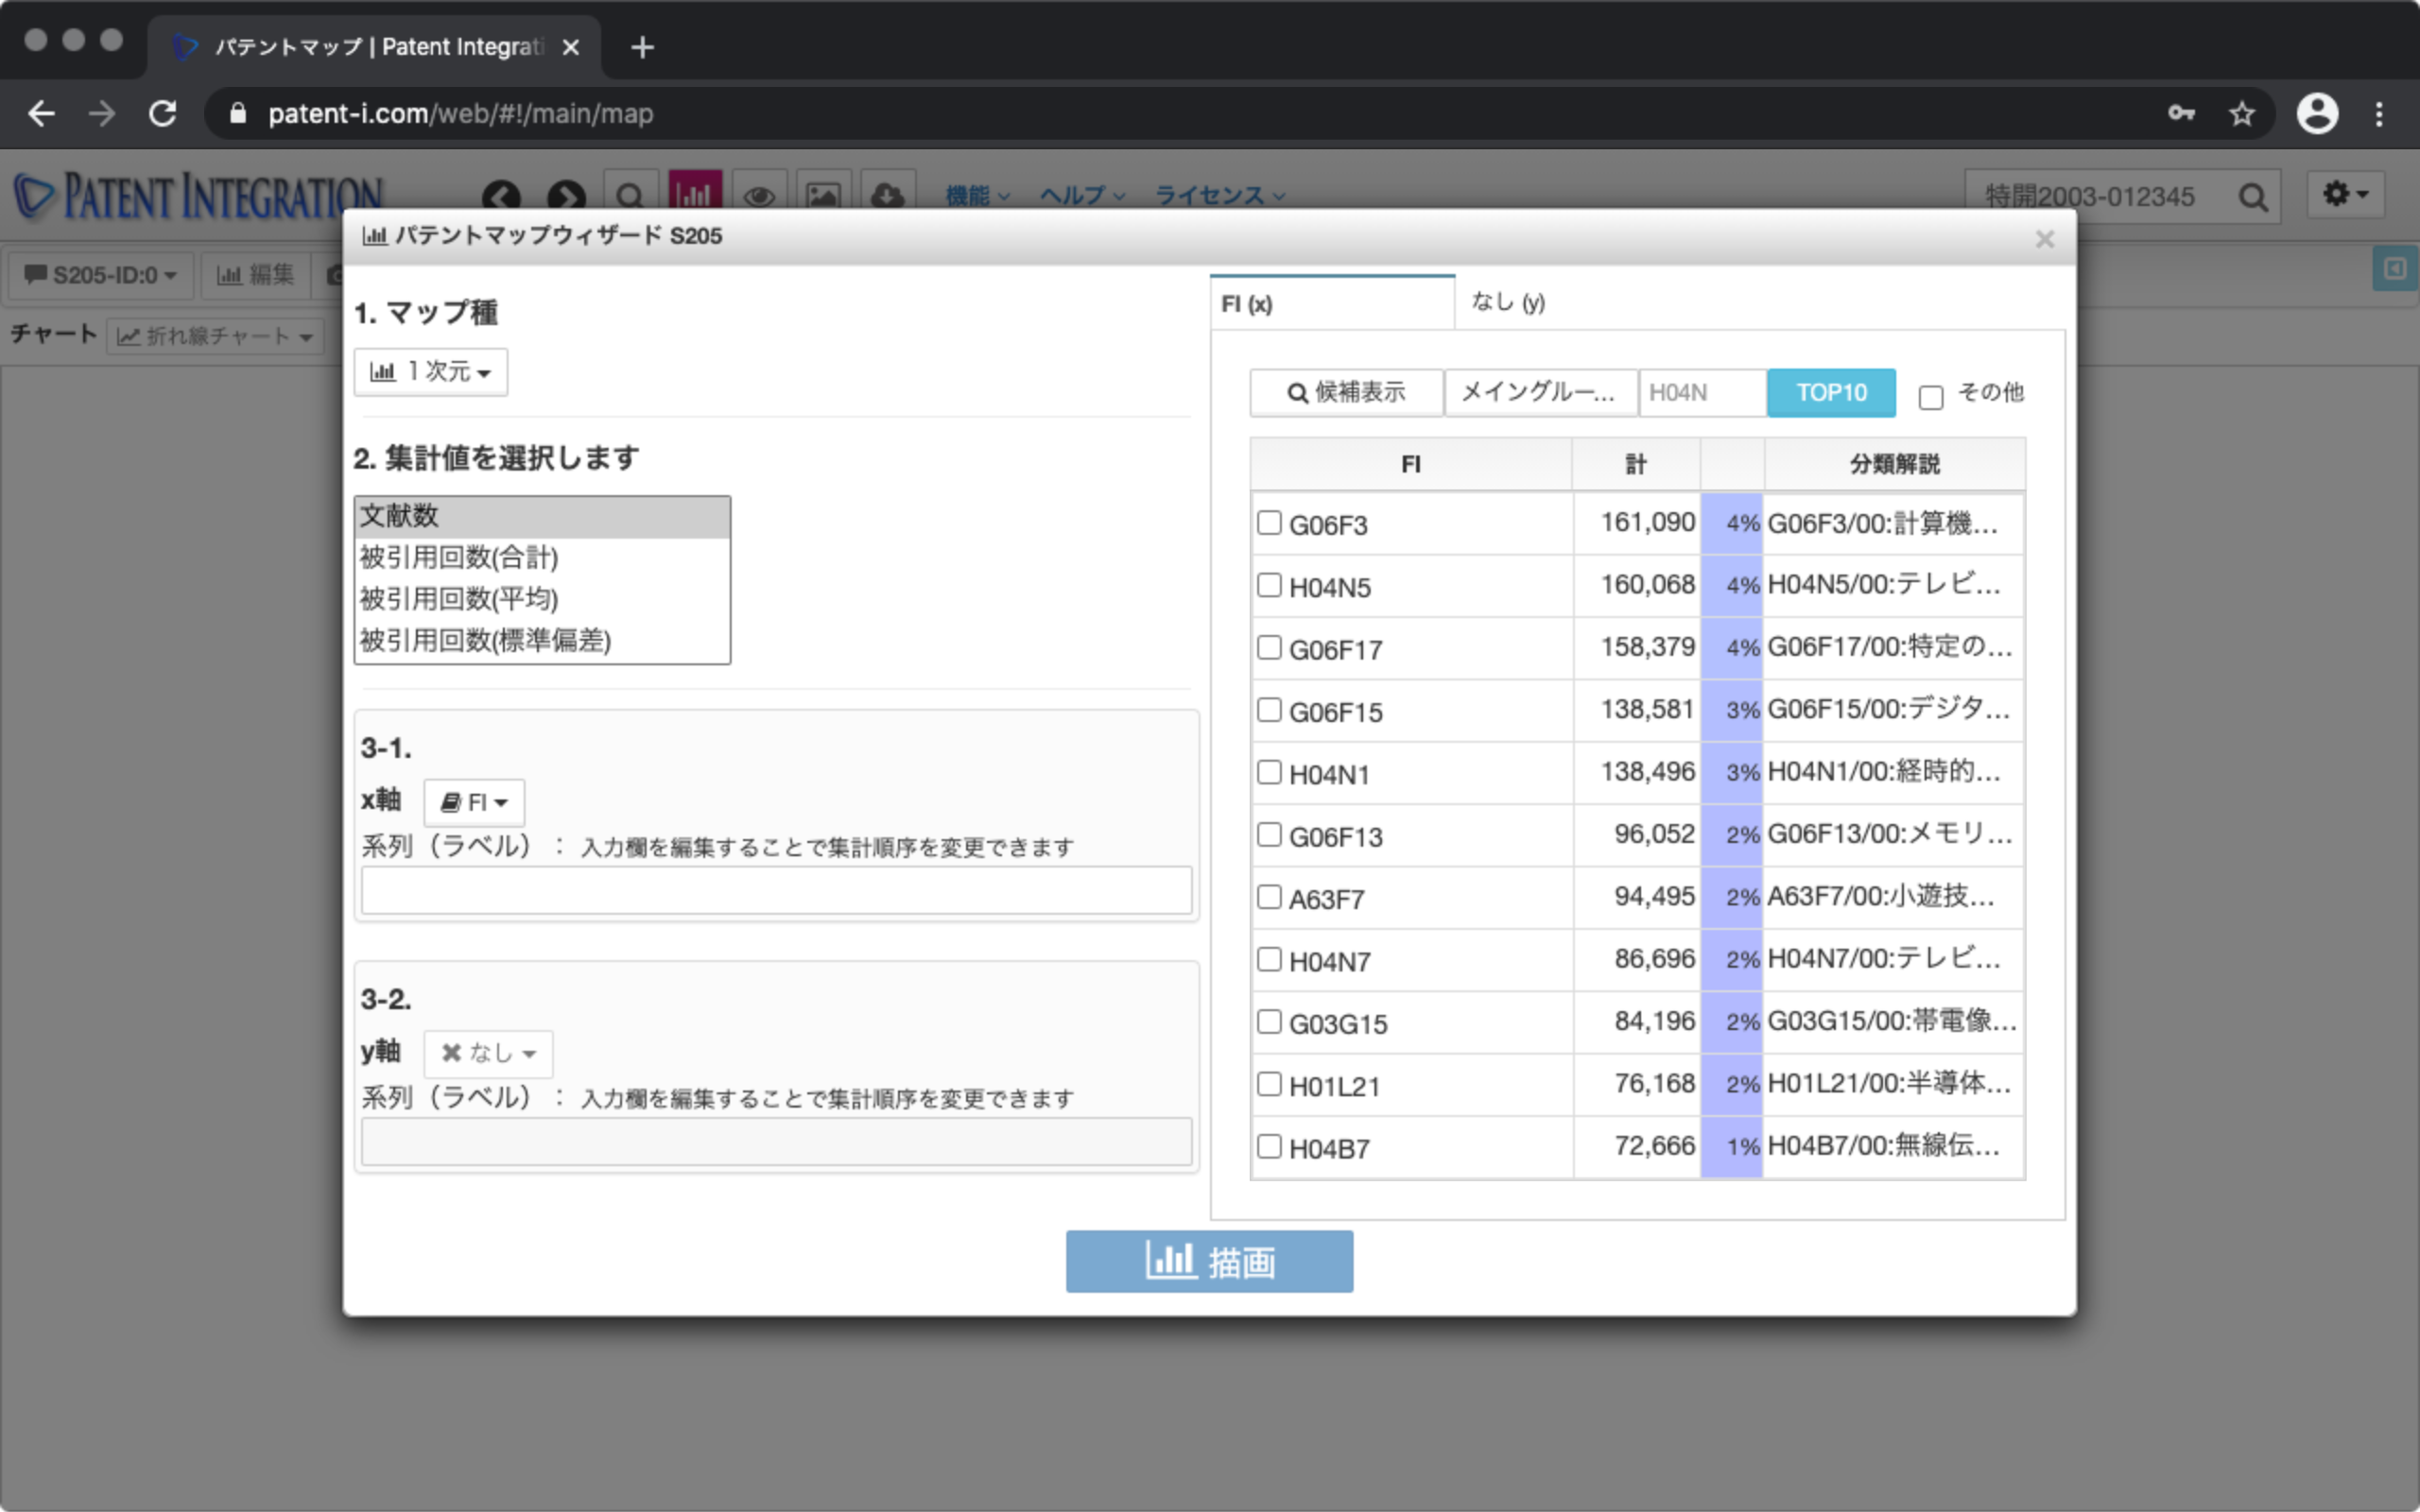
The user interface of the screen for specifying aggregation target by patent classification is shown below. You can update the candidate display (ranking) of the patent classification included in the search set by clicking the candidate display button. You can also specify a prefix when displaying candidates (for example, if you enter H, only patent classifications starting with H will be displayed).
You can select the aggregation target by checking the patent classification to be aggregated.
| ① Candidate display button | Click By doing so, you can update the candidate display. |
| ② Classification hierarchy | The patent classification hierarchy of patent classification candidates is subsectioned. You can select from various classification hierarchies such as classes. |
| ② Prefix | Specify the prefix of the patent classification candidates to be listed. can. For example, you can enter H to display only patent classifications starting with H as candidates. |
| ③ TOP10 | Automatically select the top 10 candidates from the displayed candidates Select. |
| ④ Others | If checked, other (other than the selected one) (Number of cases) is included in the aggregation target. |
| ⑤ Candidate display | The candidates to be aggregated are displayed in a list. The number of patents for each patent classification, the percentage included in the search set, and the classification explanation are also displayed. |
Patent classification patent map user interface
Patent map by legal state
The screen for specifying the aggregation target when creating a patent map based on the legal status (survival status, current examination request) is shown below.
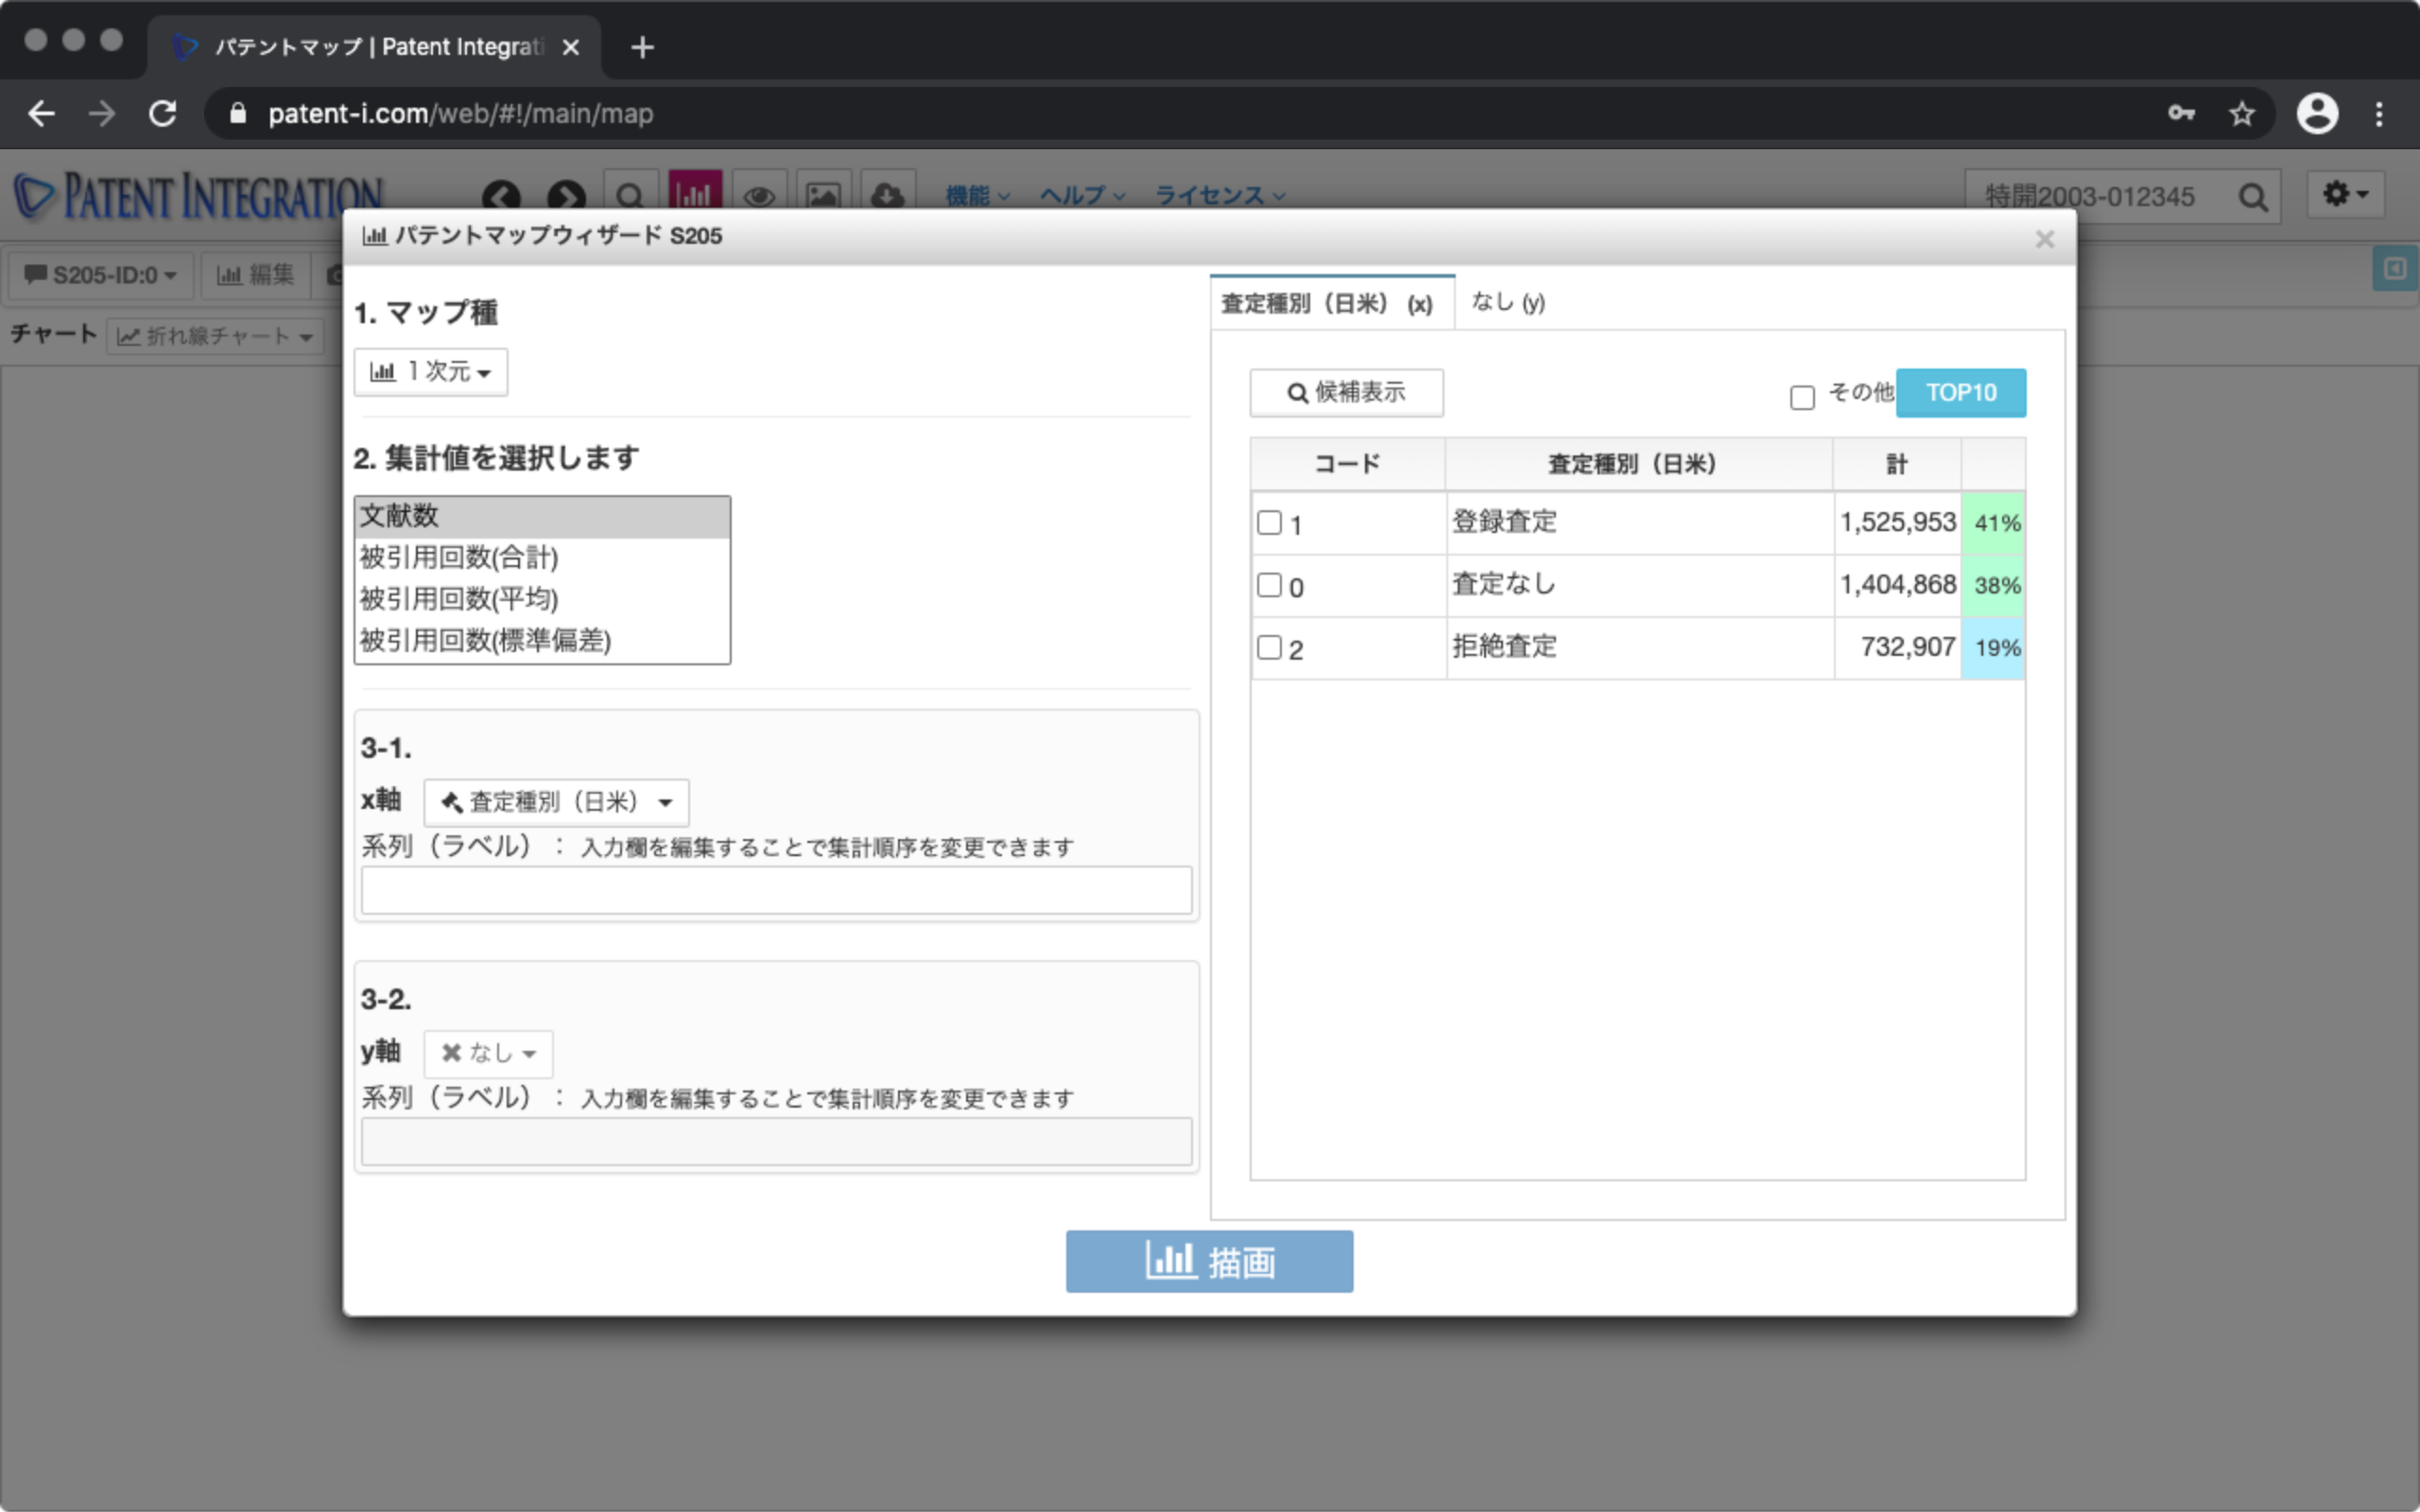
The user interface of the screen for specifying aggregation target by legal status is shown below. By clicking the candidate display button, you can update the list of legal status types (target candidates, ranking) included in the search set.
| ① Candidate display button | Click By doing so, you can update the candidate display. |
| ② TOP10 | Automatically select the top 10 candidates from the displayed candidates Select. |
| ③ Others | If checked, other (other than the selected one) Is included in the aggregation target. |
| ④ Candidate display | The candidates to be aggregated are displayed in a list. The number of patents for each legal status and the percentage included in the search set are also displayed. |
Patent map/user interface according to legal status
Patent map based on the number of citations
The screen for specifying the total range when creating a patent map based on the number of citations (including examination information such as the number of citations and the number of requests for invalidation trials) is shown below.
lbox[/images/img_wiki/6_5_citenum.png | Total range specification screen based on the number of citations ]The user interface of the total range specification screen based on the number of citations is shown below. Click the candidate display button to display the graph of the number distribution, and you can specify the aggregation range by dragging and dropping the gray area. For example, you can specify the aggregation range such as patents with 4 or more citations. You can also specify the aggregation range by directly entering a numerical value in the range.
| ① Candidate display button | Click By doing so, you can update the candidate display. |
| ② Range | Aggregation range (start value, end value). You can also edit it directly. |
| ③ Drawing unit | Interval of aggregation range (every 1 or 2) It is a unit (to perform aggregation). Edit directly. |
Patent map/user interface based on the number of citations
User evaluation (patent bookmark, rating) Patent map by
The screen for specifying the aggregation target when creating a patent map by user evaluation ( Bookmark Feature and rating ( User evaluation)) is shown below.
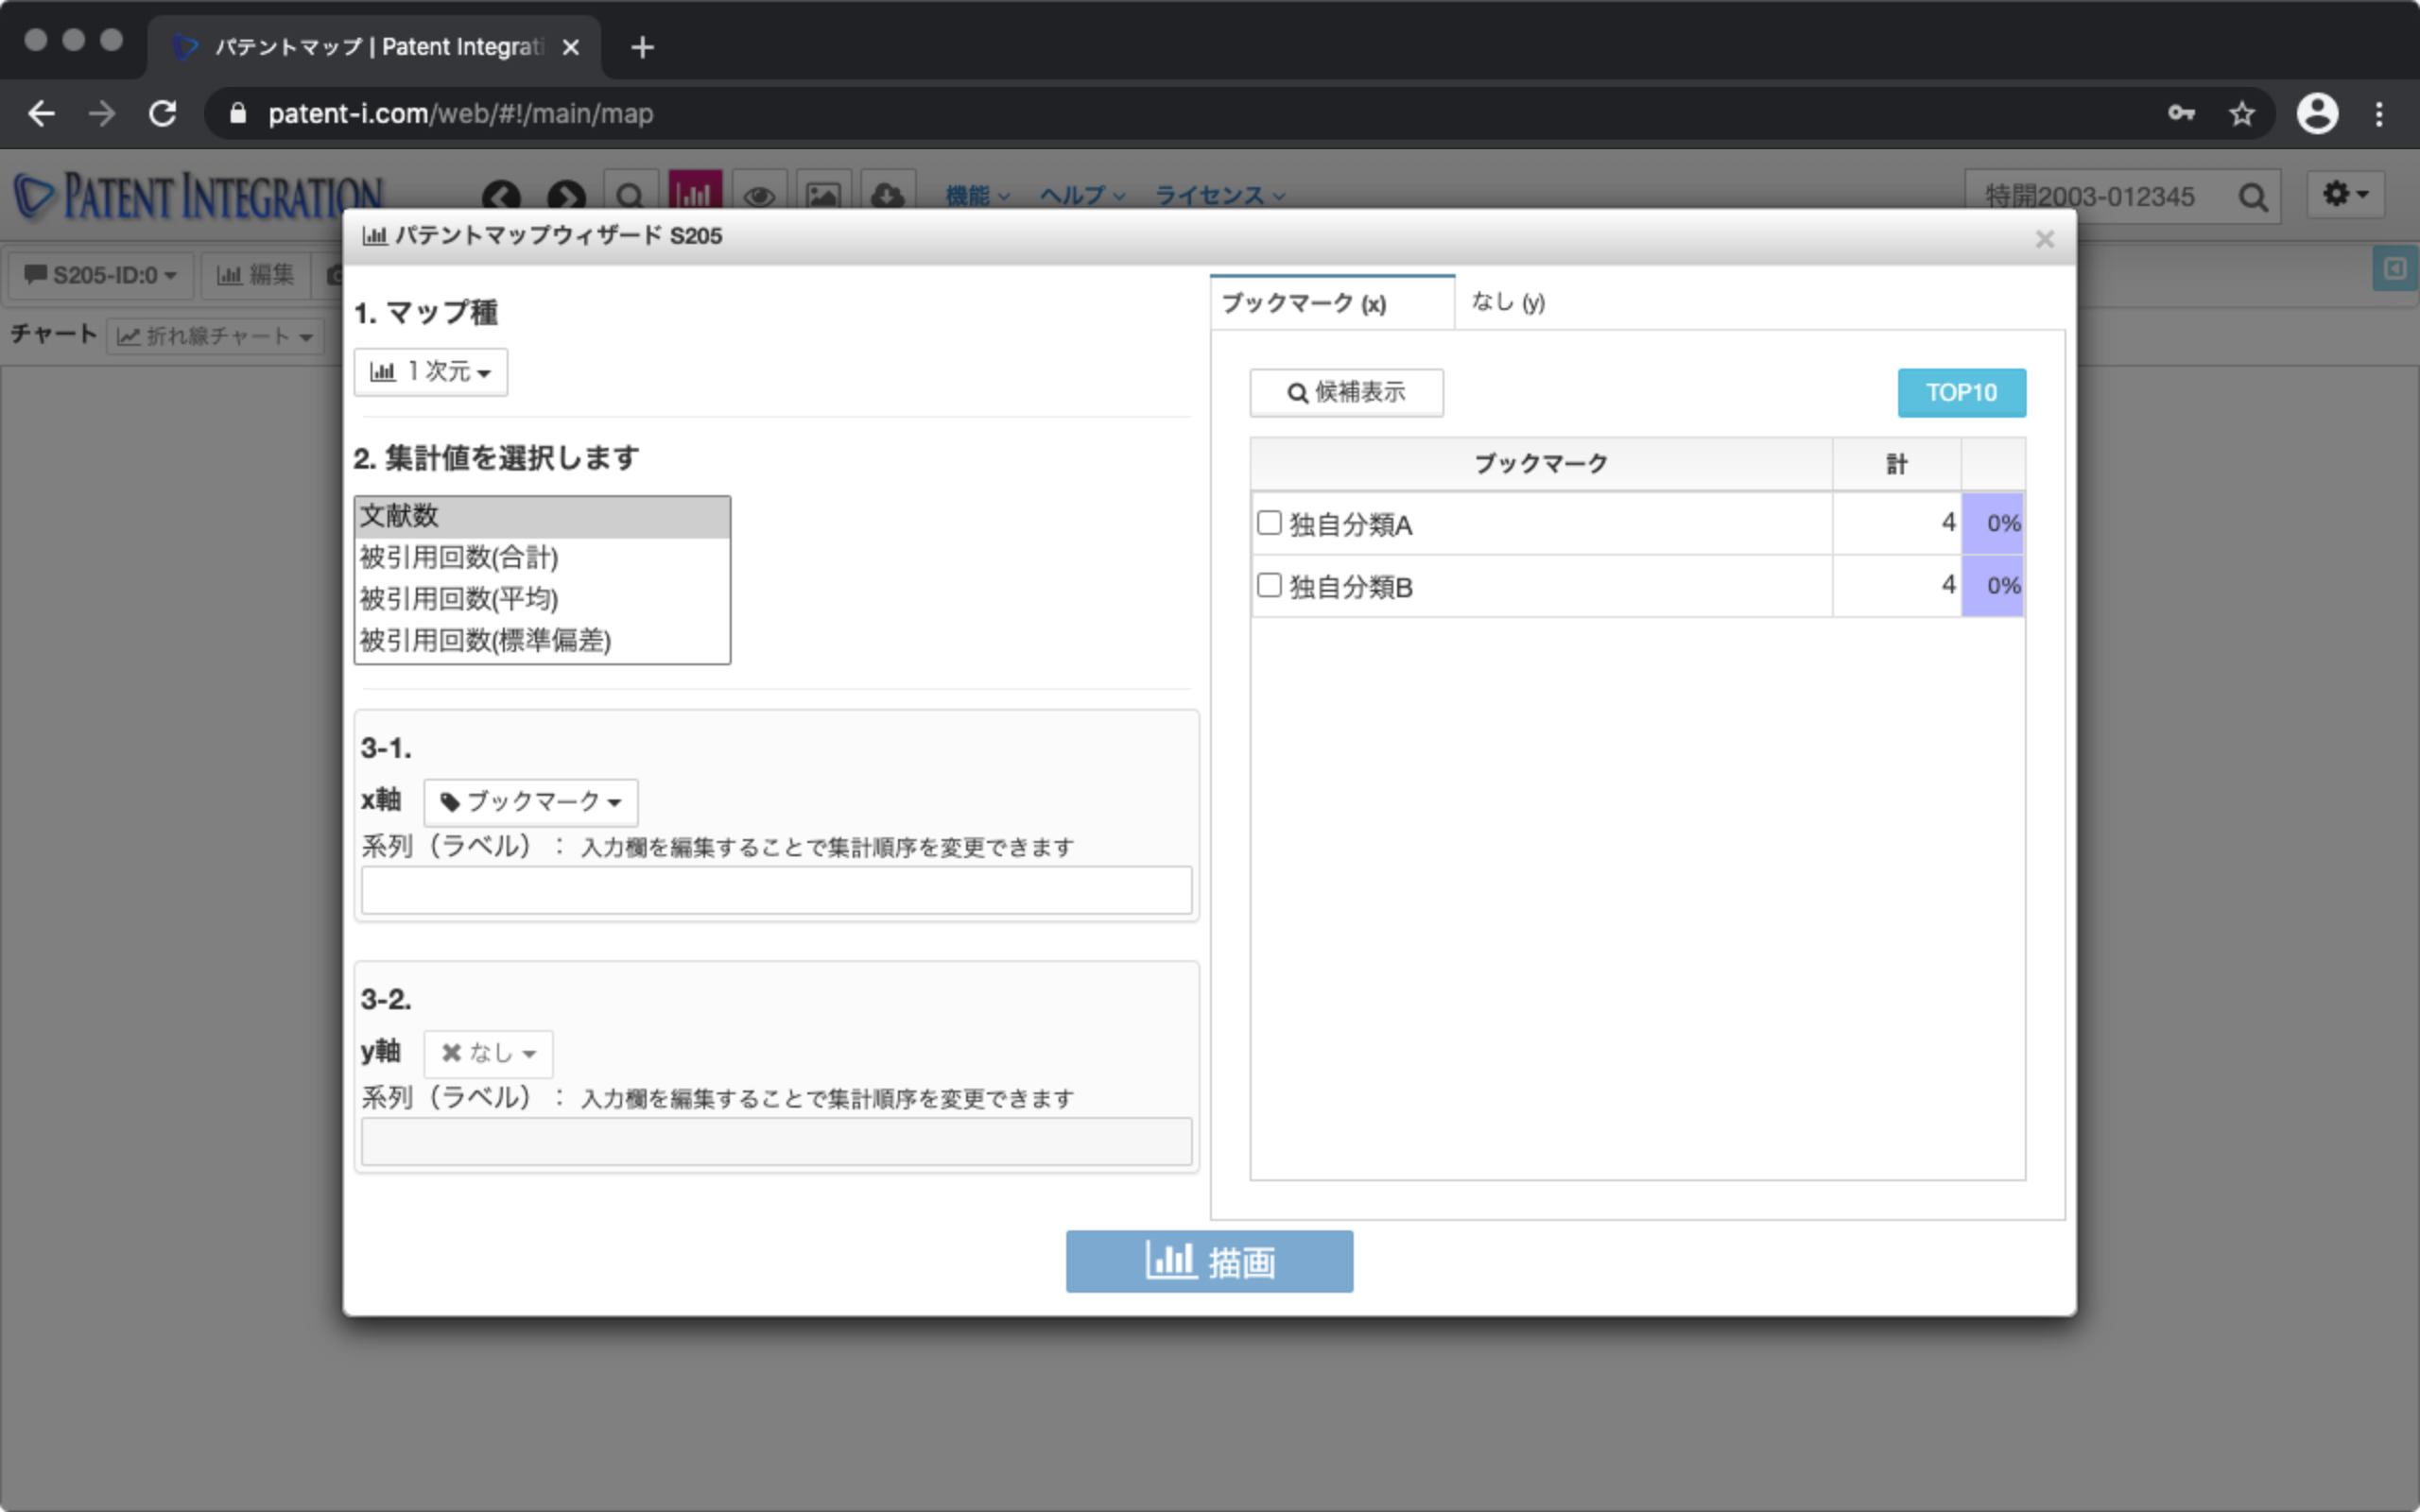
The user interface of the aggregation target specification screen by user evaluation is shown below. By clicking the candidate display button, you can update the list of user evaluation types (target candidates, ranking) included in the search set.
| ① Candidate display button | Click By doing so, you can update the candidate display. |
| ② TOP10 | Automatically select the top 10 candidates from the displayed candidates Select. |
| ③ Others | If checked, other (other than the selected one) Is included in the aggregation target. |
| ④ Candidate display | The candidates to be aggregated are displayed in a list. The number of patents for each user evaluation and the percentage included in the search set are also displayed. |
Patent map by user evaluation/user interface
Patent map by search database
The screen for specifying the aggregation target when creating a patent map using a search database (public patent gazette, patent gazette, etc.) is shown below.
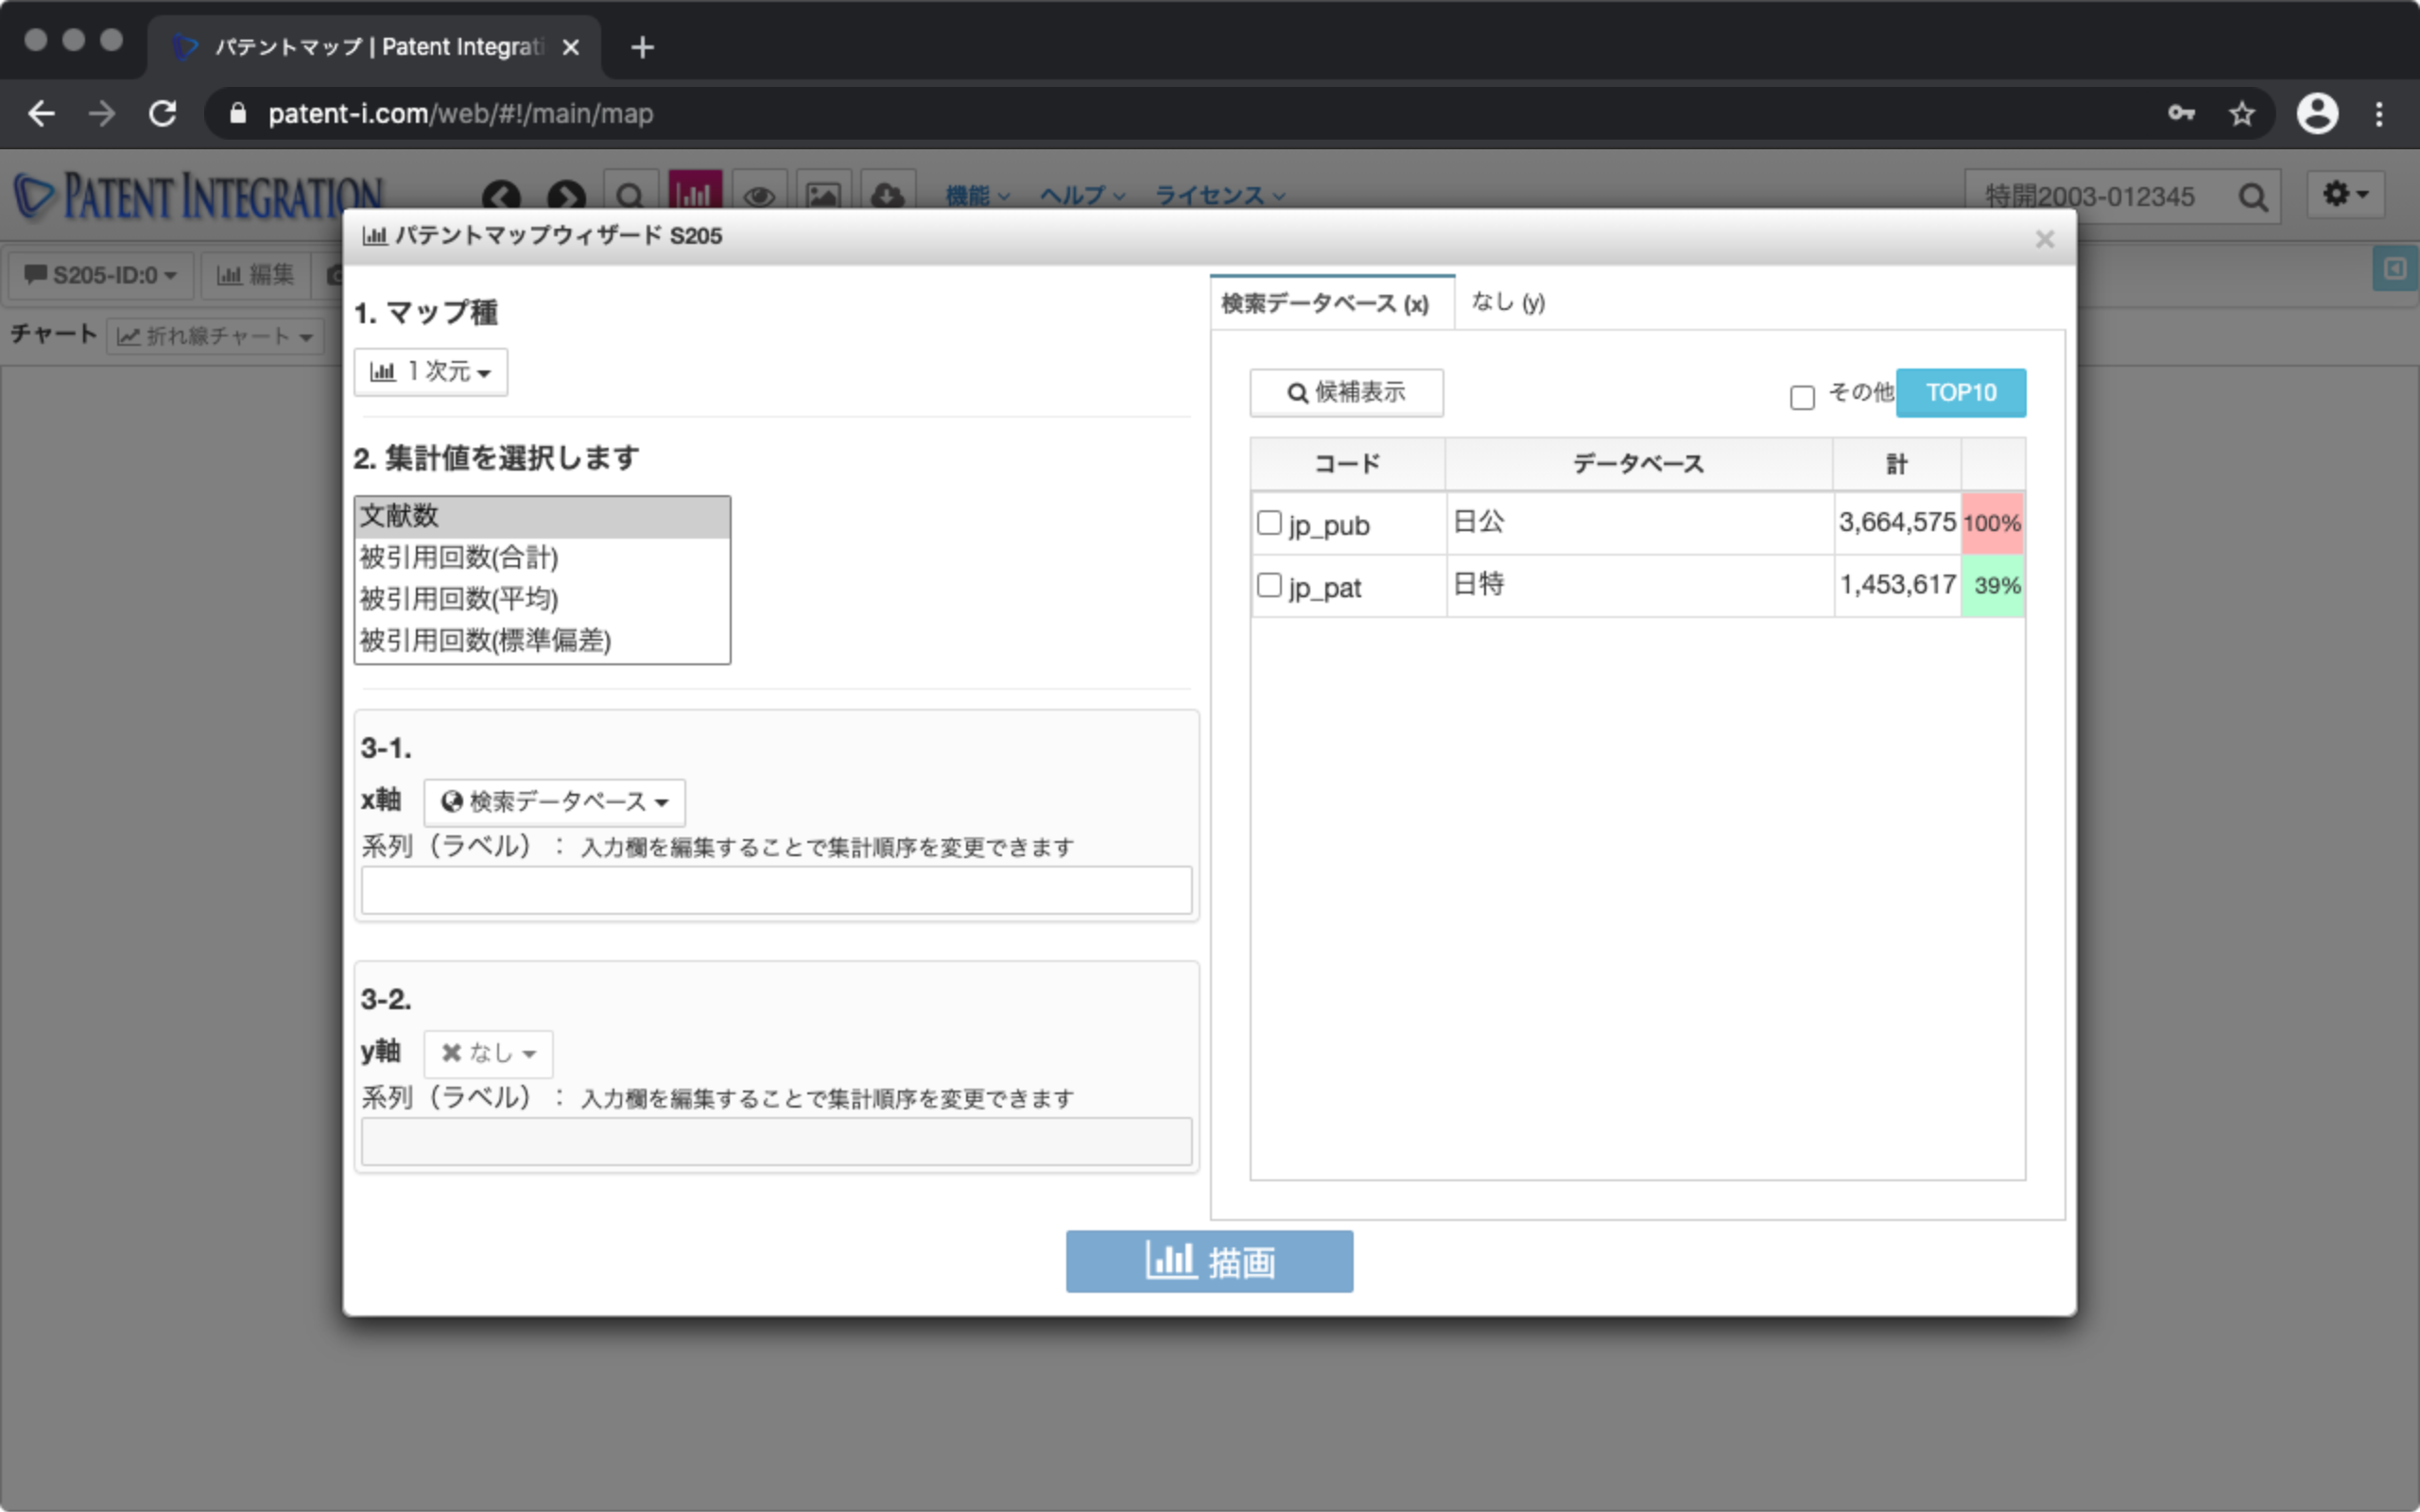
The user interface of the aggregation target specification screen by search database is shown below. By clicking the candidate display button, you can update the list of patent database types (target candidates, ranking) included in the search set.
| ① Candidate display button | Click By doing so, you can update the candidate display. |
| ② TOP10 | Automatically select the top 10 candidates from the displayed candidates Select. |
| ③ Others | If checked, other (other than the selected one) (Number of cases) is included in the aggregation target. |
| ④ Candidate display | The candidates to be aggregated are displayed in a list. The number of patents for each search database and the percentage included in the search set are also displayed. |
Patent map user interface by search database