Patent map screen
Click the Draw button in the Patent Map Wizard to aggregate patents and create a patent map (graph) under the specified conditions. The drawn patent map can be drawn by specifying various formats such as line graphs and bubble charts.
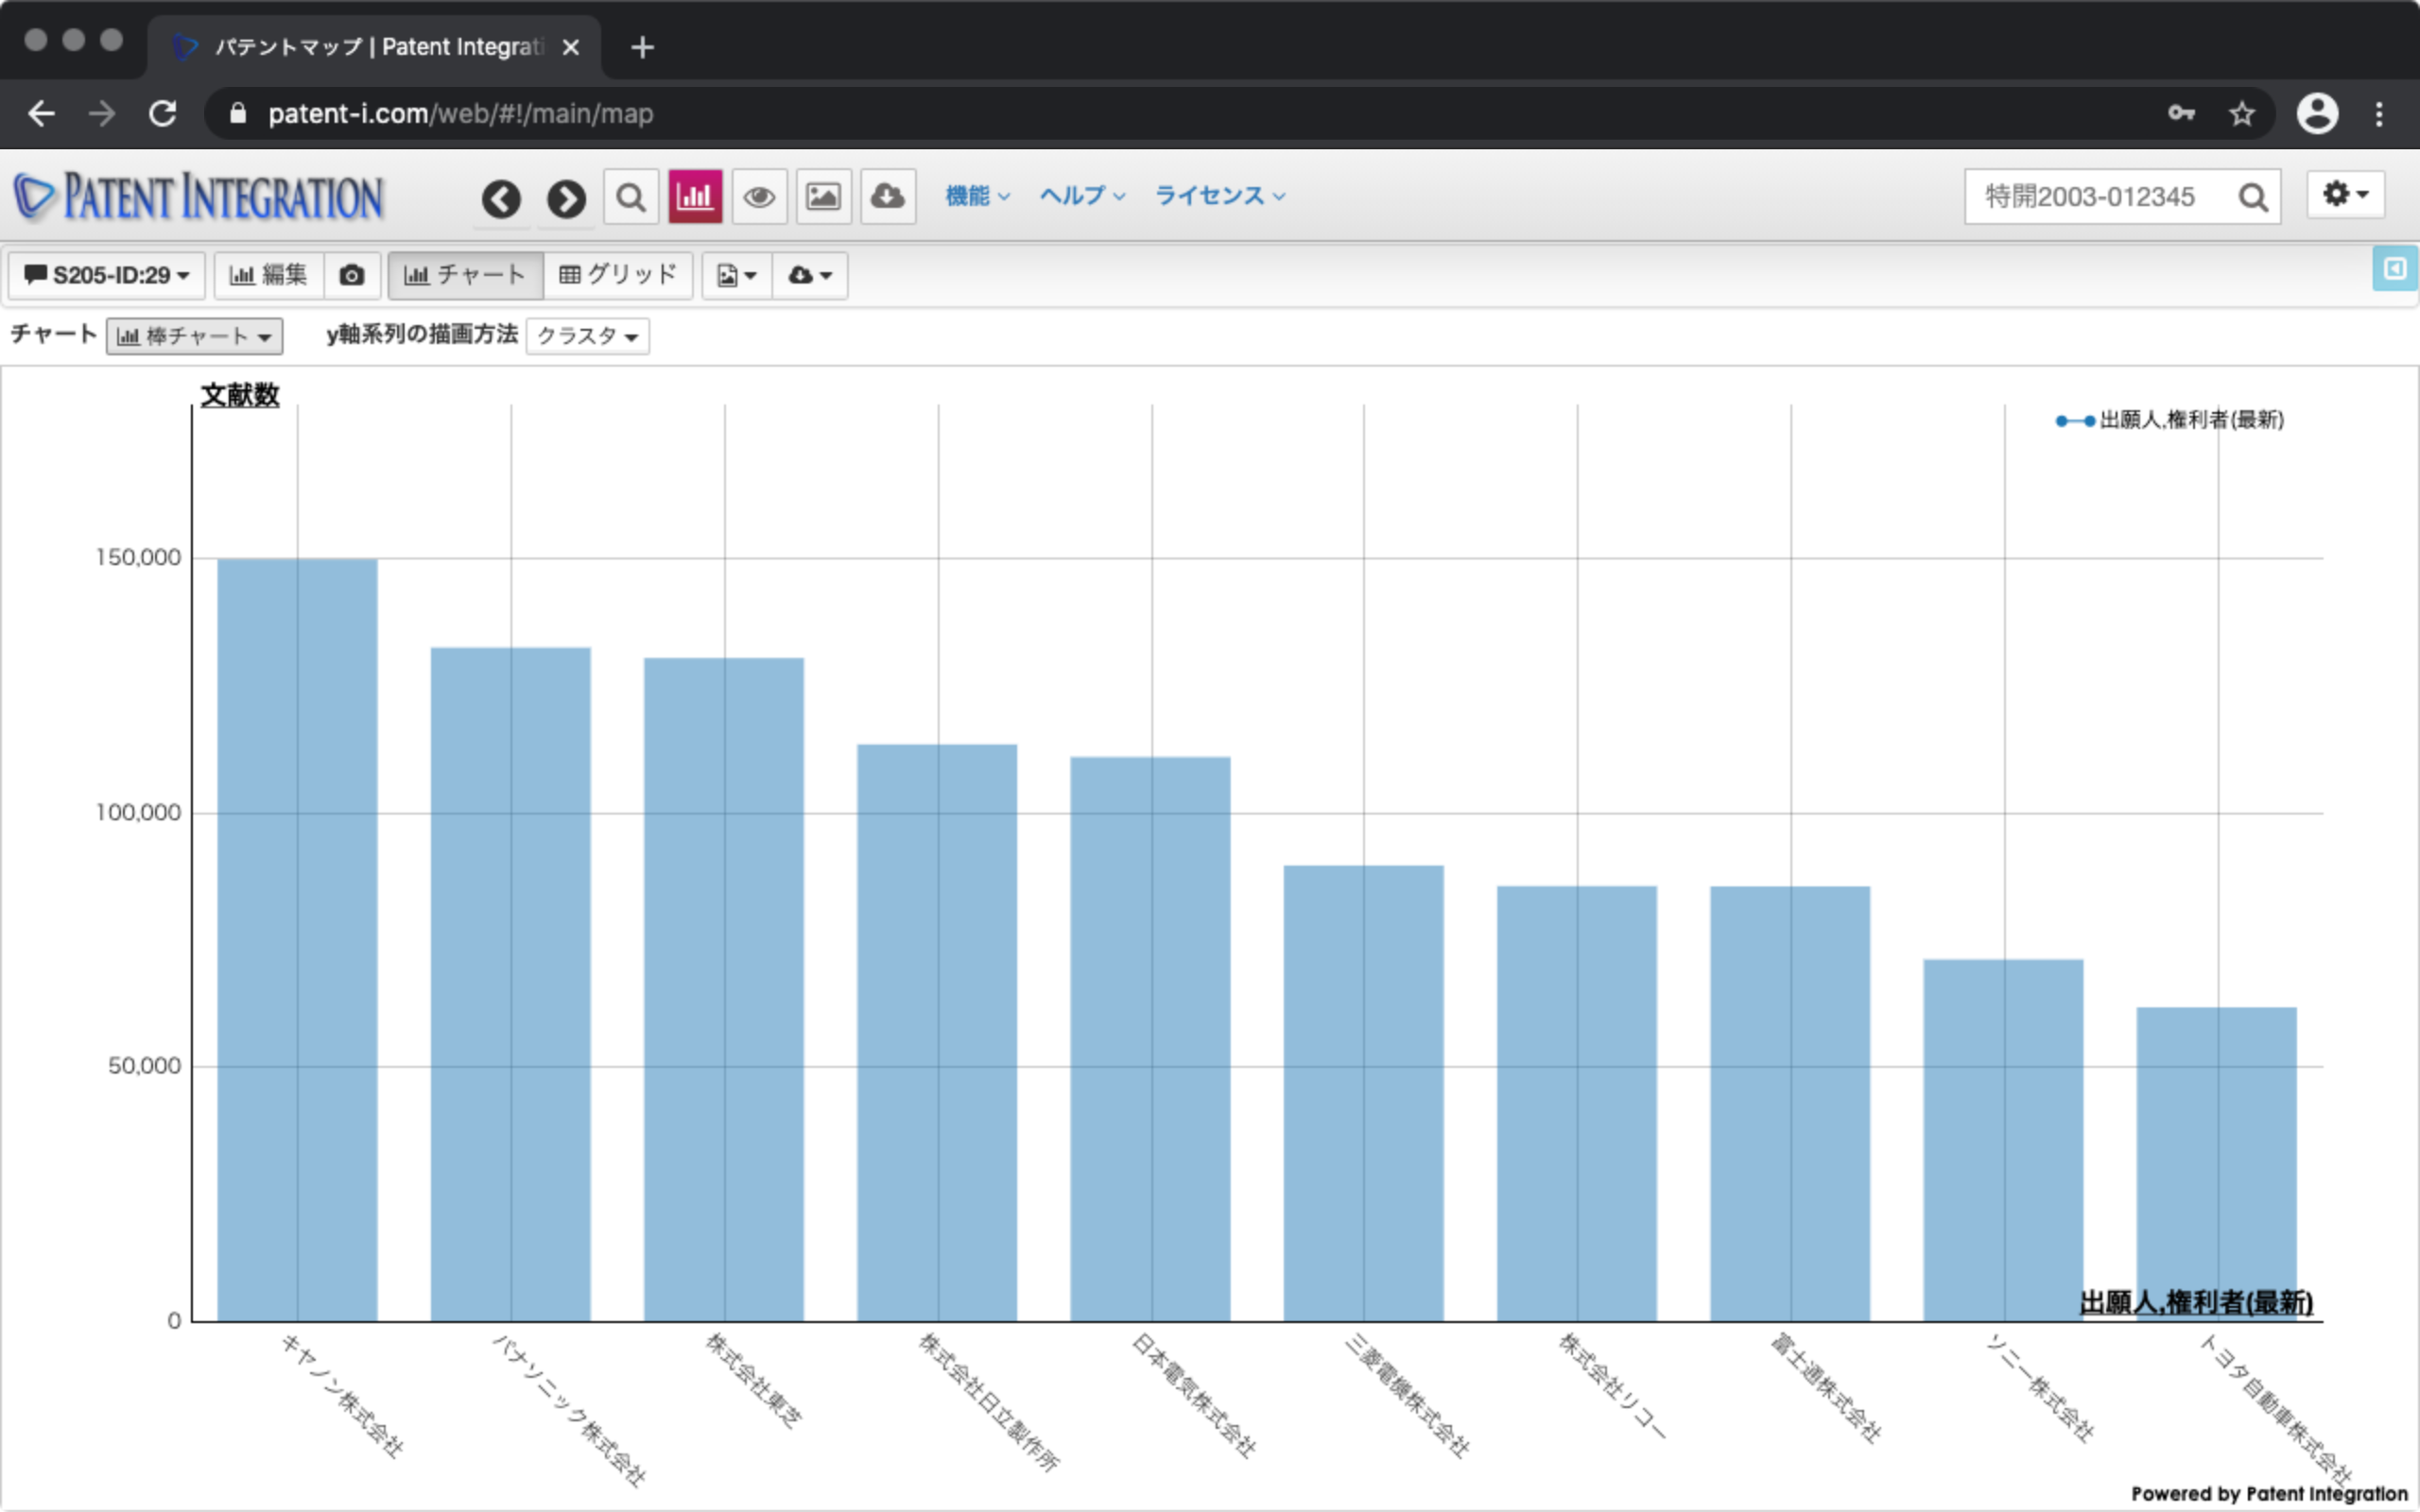
The patent map user interface is shown below.
| ① Memo button | Patent map You can record notes in. Make a note of what you noticed during the patent analysis work. In addition, the ID of the search set and the ID of the patent map are displayed on this button. You can check the recorded memo from the history management ( Search Result Control) of the search result control. |
| ② Edit | Open the Patent Map Wizard with the current aggregation conditions. It is used to modify the aggregation conditions for the currently drawn patent map and perform aggregation again. The patent map drawn by modifying the aggregation conditions is also newly saved and can be confirmed from the history management ( Search Result Control) of the search result control. |
| ③ Thumbnail | Thumbnail of patent maps created in the past in the current search set You can display the list in the format. You can redraw the patent map by clicking on it. You can also check and record memos. |
| ④ Display switching button | Chart format of the total result by patent map Select from (Graph format) and Grid format (Table format). |
| ⑤ Image Download | Created graph (chart) in PNG , JPG, PDF, SVG format. It is used when the created graph is used for reporting materials. |
| ⑥ Data download | Copy the aggregated data (grid) to the clipboard. Or download in TSV (tab-separated text) or CSV format (comma-separated text). It is used when using the aggregated data with spreadsheet software such as Excel. |
| ⑦ Chart | Lines, faces, bars, bubbles, pie charts, etc. You can draw the aggregation result in the format. |
| ⑧ How to draw y-axis series | "As a drawing method of y-axis, -Cluster (drawing independently for each series) -Duplicate (drawing duplicate series) -Stacked drawing for each series -100% (drawing at a ratio to 100%) < You can select from br> and draw. |
| ⑨ Graph | Graph Is the area where is drawn. By clicking the aggregation point (dot), you can check the patents included in the aggregation point from the patent list on the right side of the screen. By clicking the flag icon, the abstract is displayed ( Abstract display function (individual matter)) can also be done. |
| ⑩ Patent list | "aggregation By clicking the dot, this is the area where the patents included in the total points are displayed in a list. You can view individual patent documents in abstract format ( Abstract display function (individual matter)) by applying User evaluation, filter ( Filter function (User evaluation)), etc. You can also create a new search set for only the displayed list by clicking the population generation button at the bottom right. The created search set is automatically added as the patent search result of Patent Search Feature, and various analysis functions can be newly applied. |
Patent map screen/user interface