Patent Landscape Screen
Patent Landscape Click the button to draw the patent landscape. The patent landscape is a visual visualization of the distribution of patent applications by technical keyword, that is, the area of focus, and the mountains and islands indicated by the heat map contour lines indicate a cluster of patent applications, that is, a mass of patent applications. I will. And the red area of the heatmap shows that many patent applications related to the keyword have been filed.
This makes it possible to visually understand what kind of technical areas each company has focused on in the patent set and applied for patents. You can also check individual patents to see what patents are included in the area by clicking anywhere on the patent landscape.
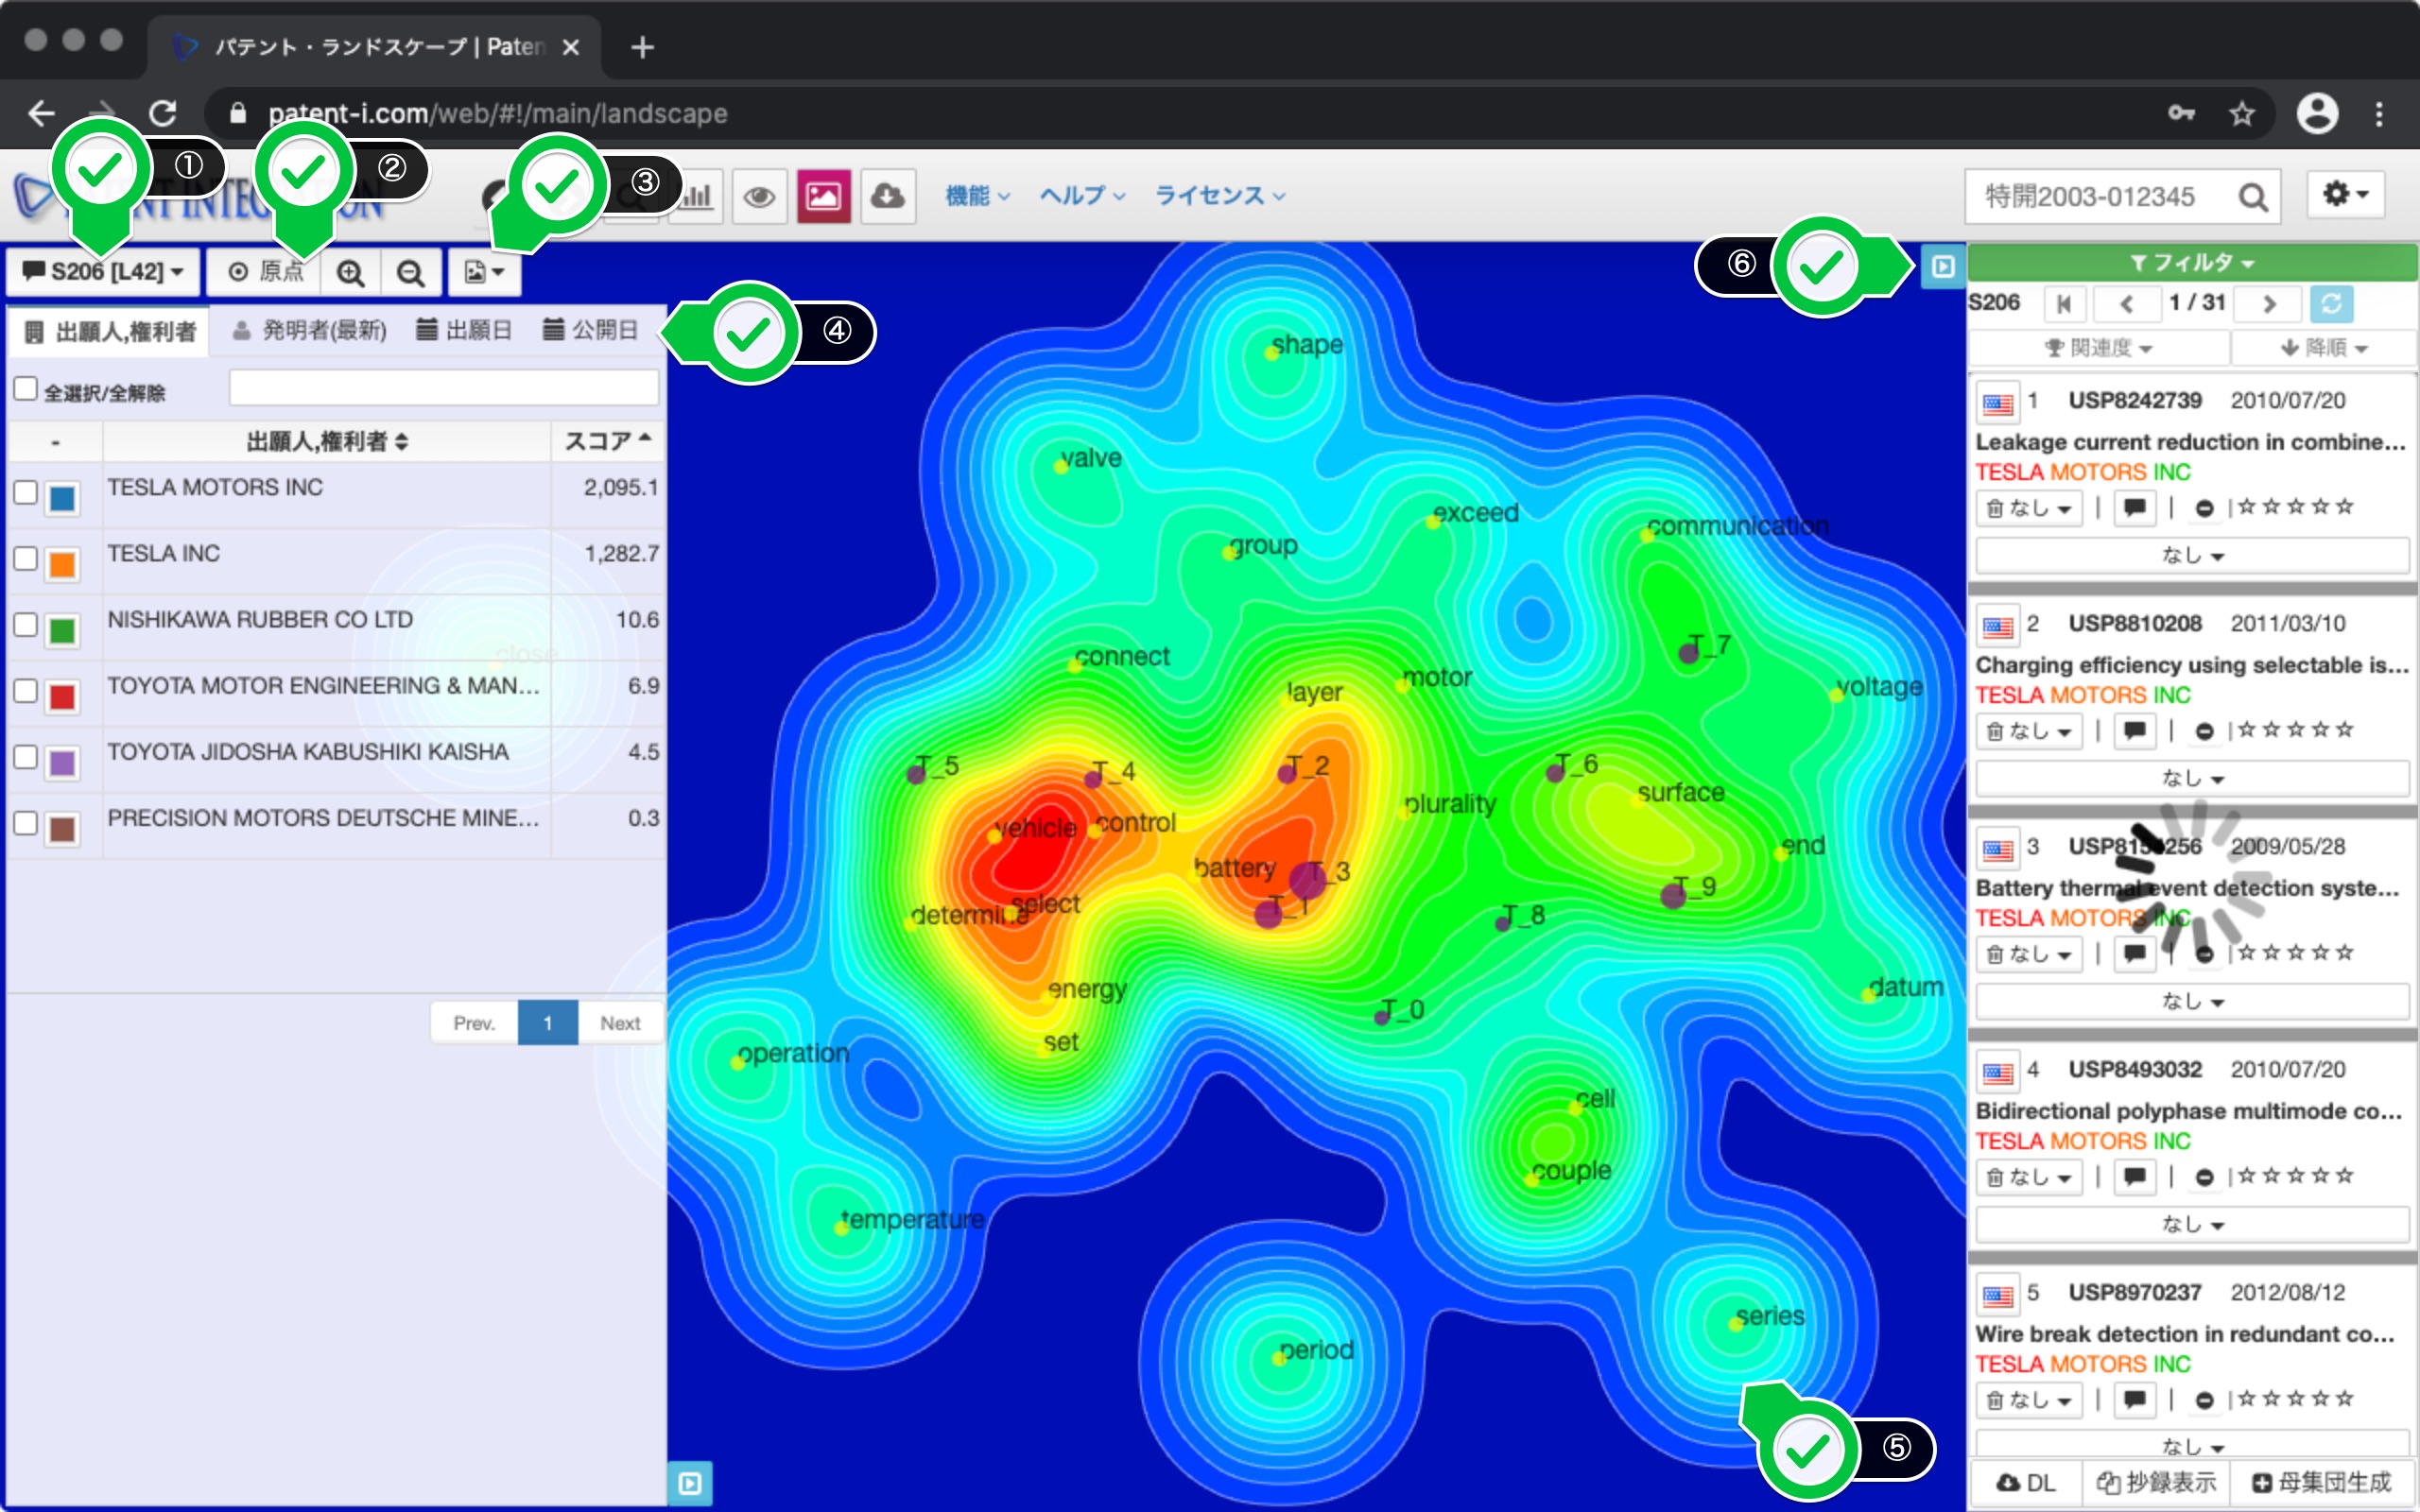
The patent landscape user interface is shown below.
| ① Memo button | Patent You can record notes in the landscape. Make a note of what you noticed during the patent analysis work. The ID of the search set and the ID of the patent landscape are displayed on this button. You can check the recorded memo from the history management ( Search Result Control) of the search result control. |
| ② Origin, enlargement/reduction | Patent by clicking the origin button -Returns the landscape display to the origin. You can zoom (enlarge/reduce) the patent landscape drawn by the enlarge/reduce button. The drawn patent landscape can also be enlarged/reduced by dragging and dropping with the mouse and scrolling. |
| ③ Image download | Created graph (chart) in PNG, JPG, Download in PDF or SVG format. It is used when the created graph is used for reporting materials. |
| ④ Filter panel | Applicant/right holder, inventor, filing date, You can screen patent landscapes drawn on the release date, etc. Score is an index showing the weight of the corresponding item in the drawn patent landscape based on the number of applications and the connection with the keyword. Normally, the higher the number of applications, the higher the score, so it is used as a guide for leading applicants and the year of application/publication with a large number of applications. |
| ⑤ Drawing area | The patent landscape is drawn. By clicking on the screen, the patents with high relevance at that position will be displayed in the patent list. The patents listed are ranked higher as they are more important according to their relevance to the keyword. Also, the dot starting with T is a topic node, which indicates the position of the center of gravity of a topic (keyword block, concept) consisting of multiple keywords. It is plotted at the center of multiple keywords that make up the topic. You can also click the topic node. |
| ⑥ Patent list | Click anywhere on the patent landscape Will list the patents so that the patents that are more relevant to nearby keywords are ranked higher based on the click position. You can view individual patent documents in abstract format ( Abstract display function (individual matter)) by applying User evaluation, filter ( Filter function (User evaluation)), etc. |
Patent Landscape Screen User Interface