Patent Text Mining
Visualization of patent set
How to use the patent text mining function
In this video, we will introduce the procedure for visualizing patent search sets and technology clusters using the text mining function.
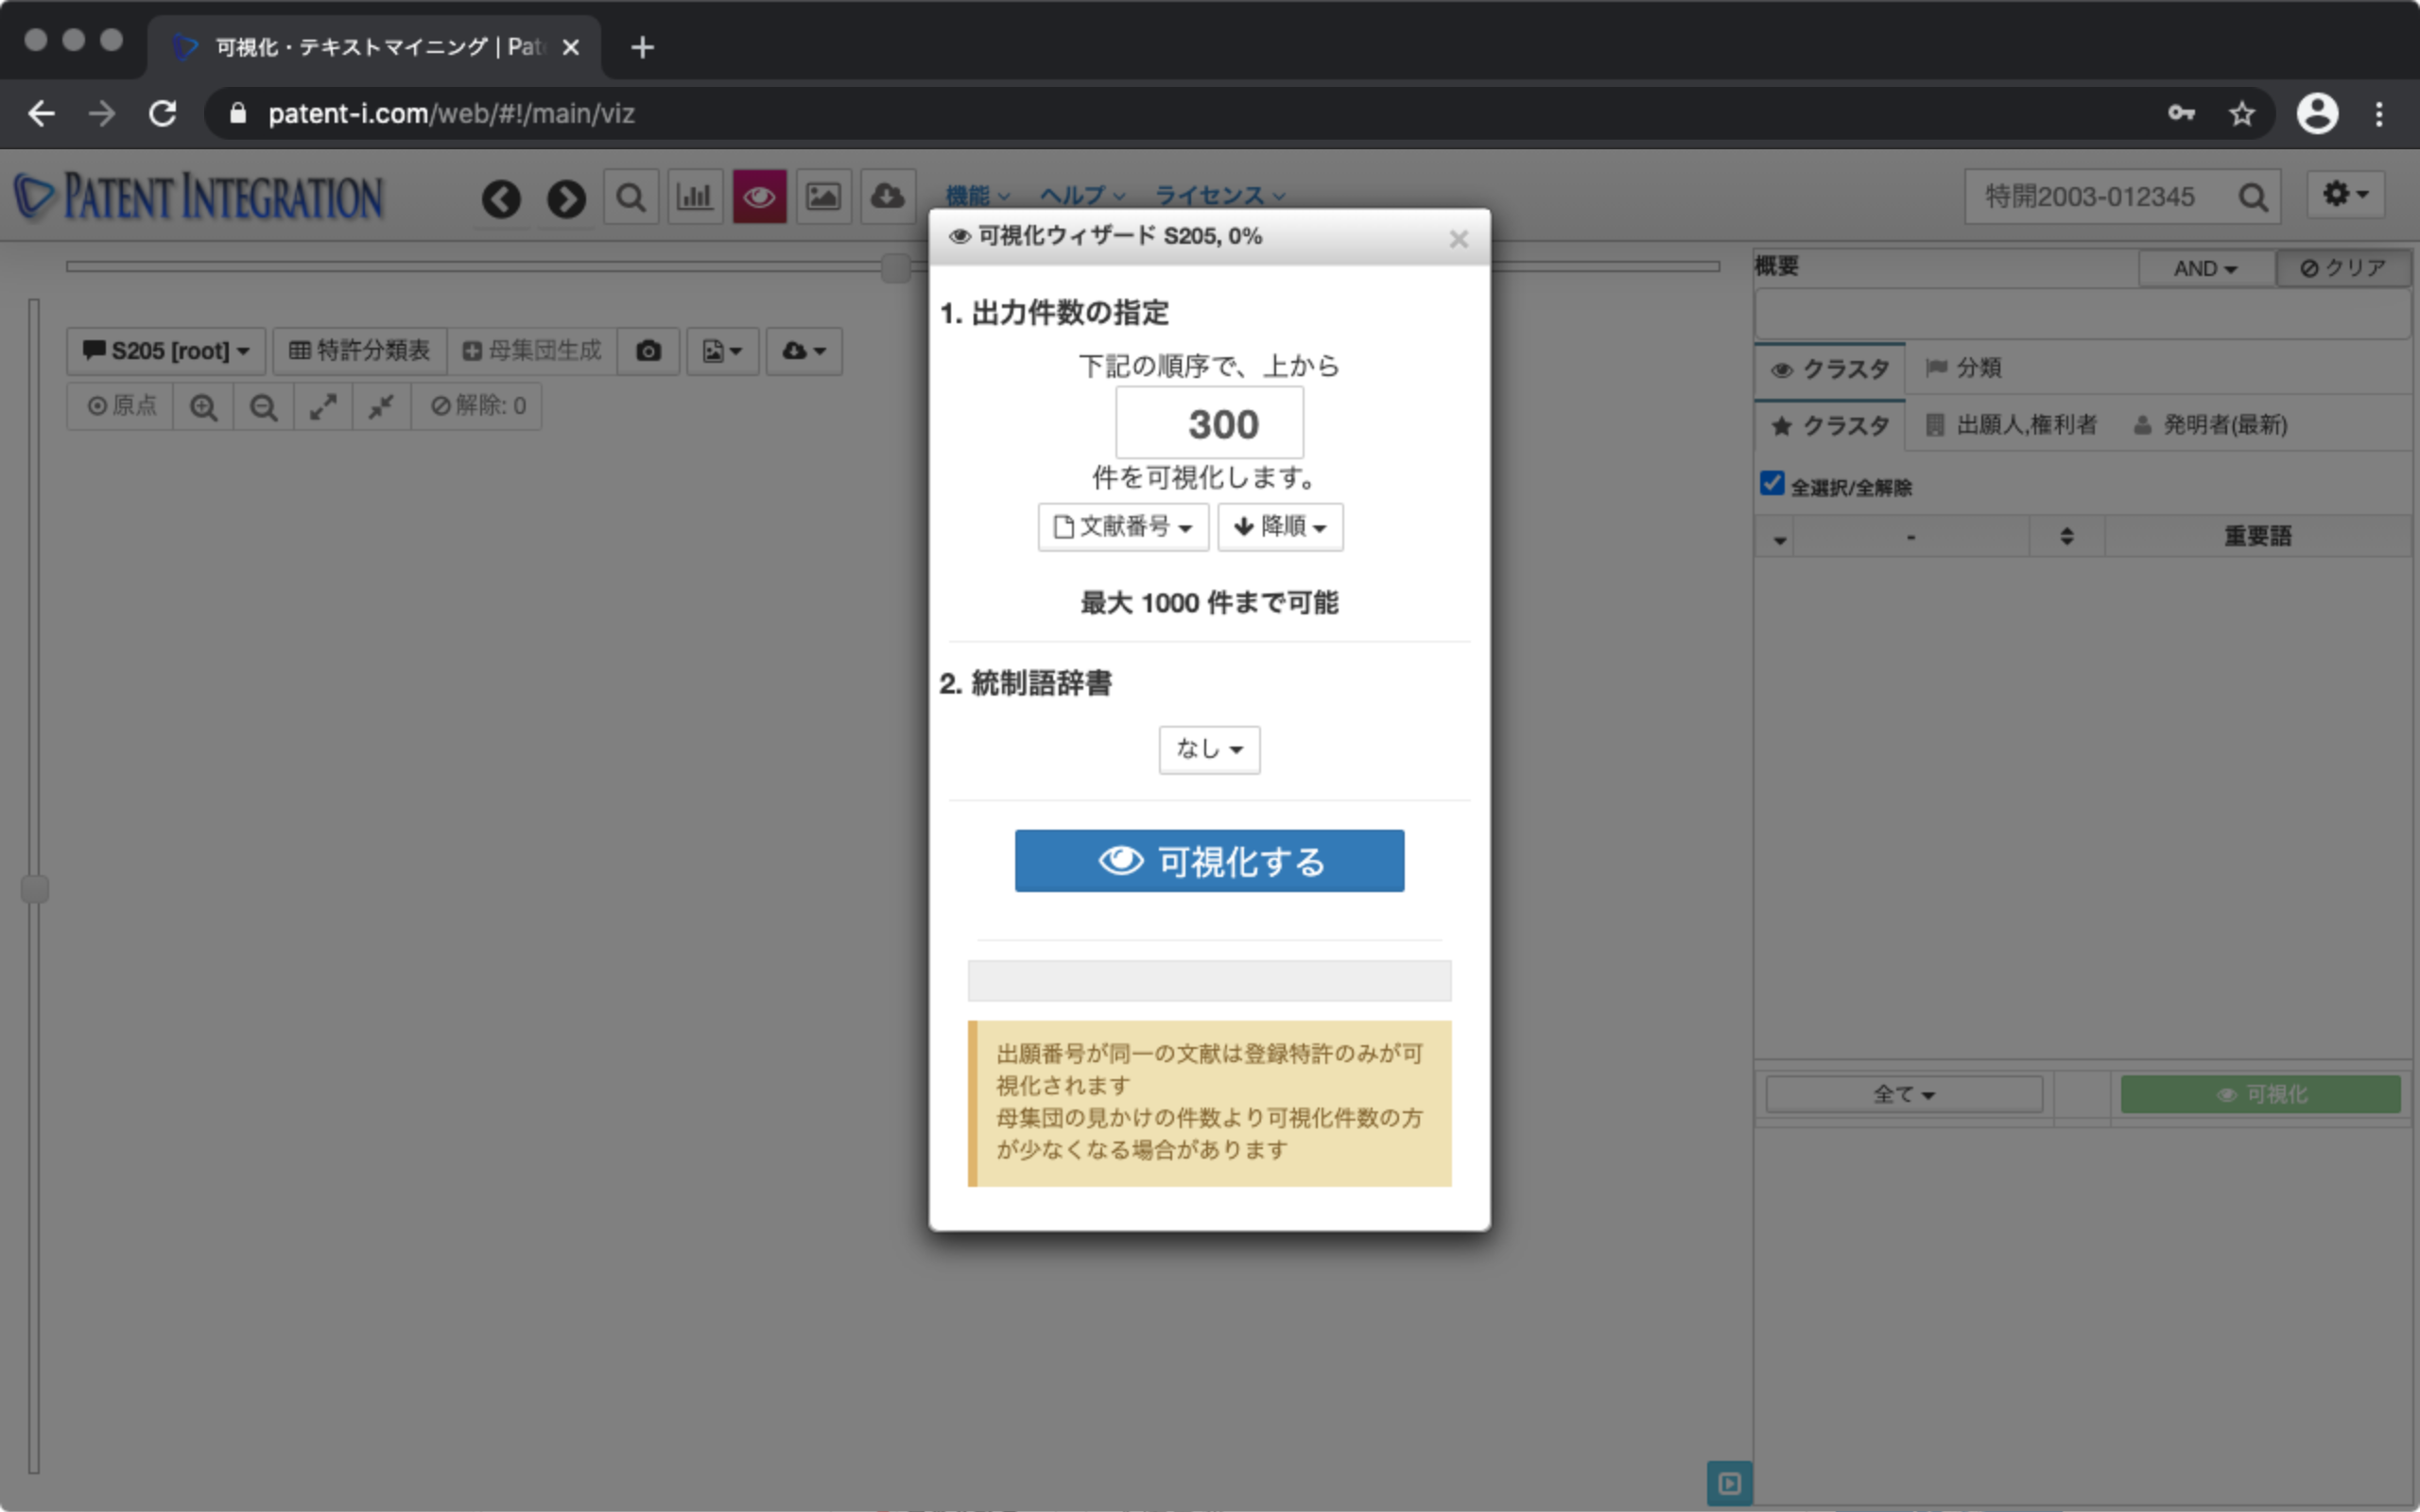
Select Visualization from the patent analysis menu of Search Result Control to open the Visualization Wizard screen. The visualization wizard screen is shown below. With the text mining function, you can visually visualize a set of patents of 1,000 or less.
The user interface of the Visualization Wizard is shown below.
| ① Specify the number of outputs | Specify the number of patents to be analyzed by the text mining function. You can specify up to 1,000 items. For a patent search set of 1,000 or more, the top 1,000 patents can be analyzed in ascending/descending sort order such as document number and filing date. |
| ② Visualize | Click to perform text mining processing for the search number set. It will start. |
Visualization Wizard Screen/User Interface
Specify the number of output items and click the button to visualize. By doing so, the analysis work for the patent document will start. You can check the progress of the analysis from the progress bar of the visualization wizard.
